This article was published in NZ Geomechanics News, December 2022 pp58 – 61.
By Ian Brown
TAGA Engineering Software Limited
Keywords: Slope stability, seismic hazard, TSLOPE, limit equilibrium analysis
Abstract
For many sites in New Zealand, the recently announced National Seismic Hazard Model (NSHM) has indicated levels of shaking that will make it difficult, in some cases, to establish site stability when calculated in a conventional 2D limit equilibrium slope stability analysis. We provide an example that shows when 3D effects are taken into account, the out of plane (third dimension) resisting forces provide sufficient additional restraint that indicates stability of the 3D volume of soil.
1. Introduction
Pseudostatic procedures are commonly used for analysis of the seismic stability of slopes. This is a relatively simple procedure that is included in limit equilibrium slope stability analysis programs, and can be used to determine if more complex analyses are needed. For background into seismic slope stability analysis procedures, we recommend Chapter 10 in the Duncan et al. (2014) text book.
As part of a pseudostatic analysis, earthquake loading on a slope is represented by a pseudostatic force, equal to the weight of the potential sliding volume of soil multiplied by a seismic coefficient, k. The selection of k is a critical step in the analysis. A rational method for selection of seismic coefficients is outlined by Pyke (2017) and Kramer (1995).
On October 4, 2022 GNS released the revised New Zealand National Seismic Hazard Model (NSHM) results. These provide a means of estimating the strength and associated likelihood of earthquake ground shaking that might occur at any given site in New Zealand. As part of the release of the NSHM, Ministry of Business, Innovation & Employment (MBIE) indicated that time will be required to determine how the revised hazard information will be applied. MBIE has plans to consult on an initial set of proposed changes to building standards in mid-2023.
The use of the NSHM results in generally increased hazard estimates across the country, with some areas, such as Wellington predicted to sustain significantly higher hazard levels. The upshot of this is that we are going to have to figure out how to design slopes to resist stronger shaking with limited deformations. Independently of how the seismic coefficient is derived, the NSHM will yield stronger ground motions than that which would result in the application of NZS 1170.5.
One of the ways we can effectively assess whether a slope has sufficient resistance to a pseudostatic earthquake force is to use a 3D limit equilibrium analysis, rather than the traditional 2D methods. We have applied a 3D approach to a number of slope studies in the Wellington region, including a slope adjacent to the Wellington Fault that was described by McPherson (2017).
This paper provides an example where 2D analyses underestimate the factor of safety, and shows how a 3D analysis can provide a better understanding of how the slope is likely to behave under seismic loading.
2. Slope example
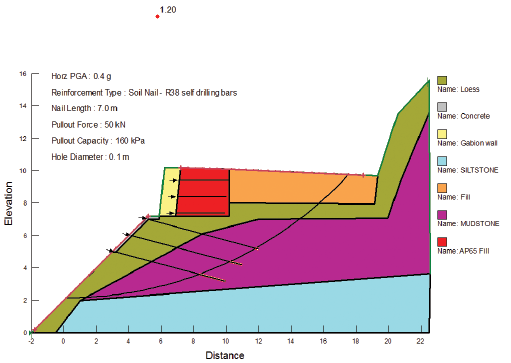
Kendal-Riches (2017) described the North Canterbury Transport Infrastructure Recovery design for wall 375 that was constructed as part of the repair of State Highway 1 following the 2016 Kaikoura earthquake. The wall comprised a gabion basket wall immediately above a soil nailed slope. The 2D model used for analysis with program SLOPE/W is shown on Figure 1, along with the result of a pseudostatic analysis for the Ultimate Limit State (ULS).
In this case, the applied earthquake loading was provided by a horizontal seismic coefficient (k) of 0.4. The peak ground acceleration (PGA) used in the estimate of k would be larger than 0.4g as shown on Figure 1.
Figure 1. SLOPE/W model (after Kendal-Riches, 2018)
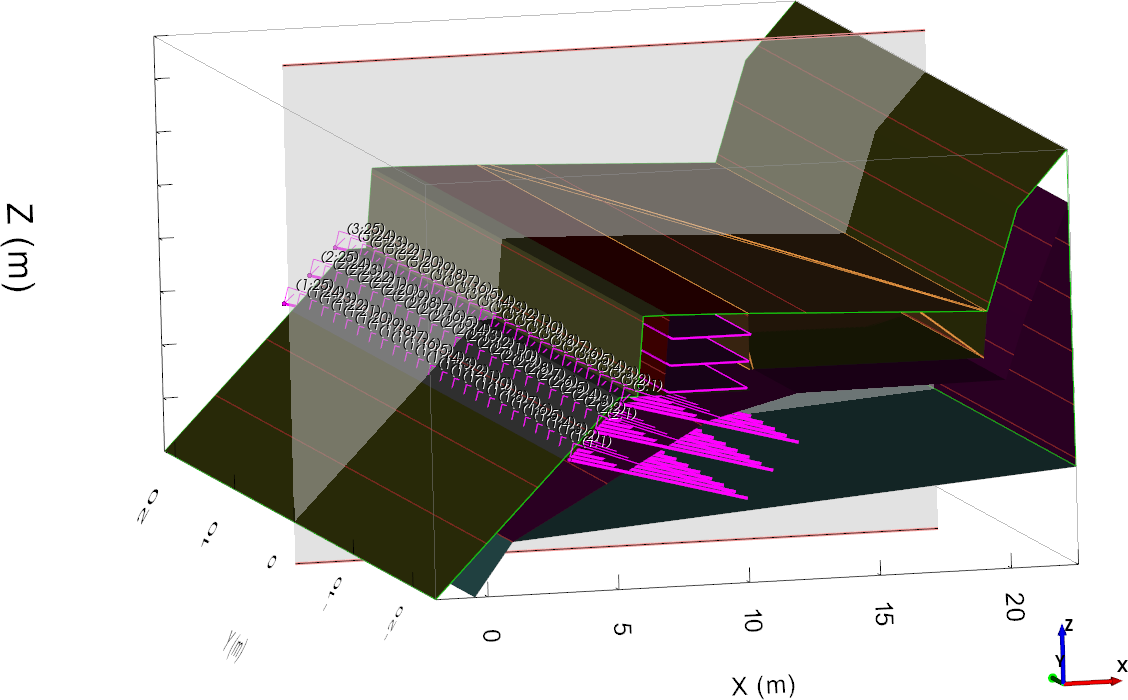
We imported the SLOPE/W model into TSLOPE, a 2D and 3D limit equilibrium slope stability analysis program. The material parameters, slope reinforcement (soil nails, geofabric), and all subsurface geometry are used to establish the 3D model, as shown in Figure 2. The boundaries of the 2D regions comprising the different materials shown in Figure 1 are automatically extruded to form volumes in TSLOPE.
Figure 2. TSLOPE model showing soil volumes, anchors, geofabric and transparent panel on line of section used for 2D slope case
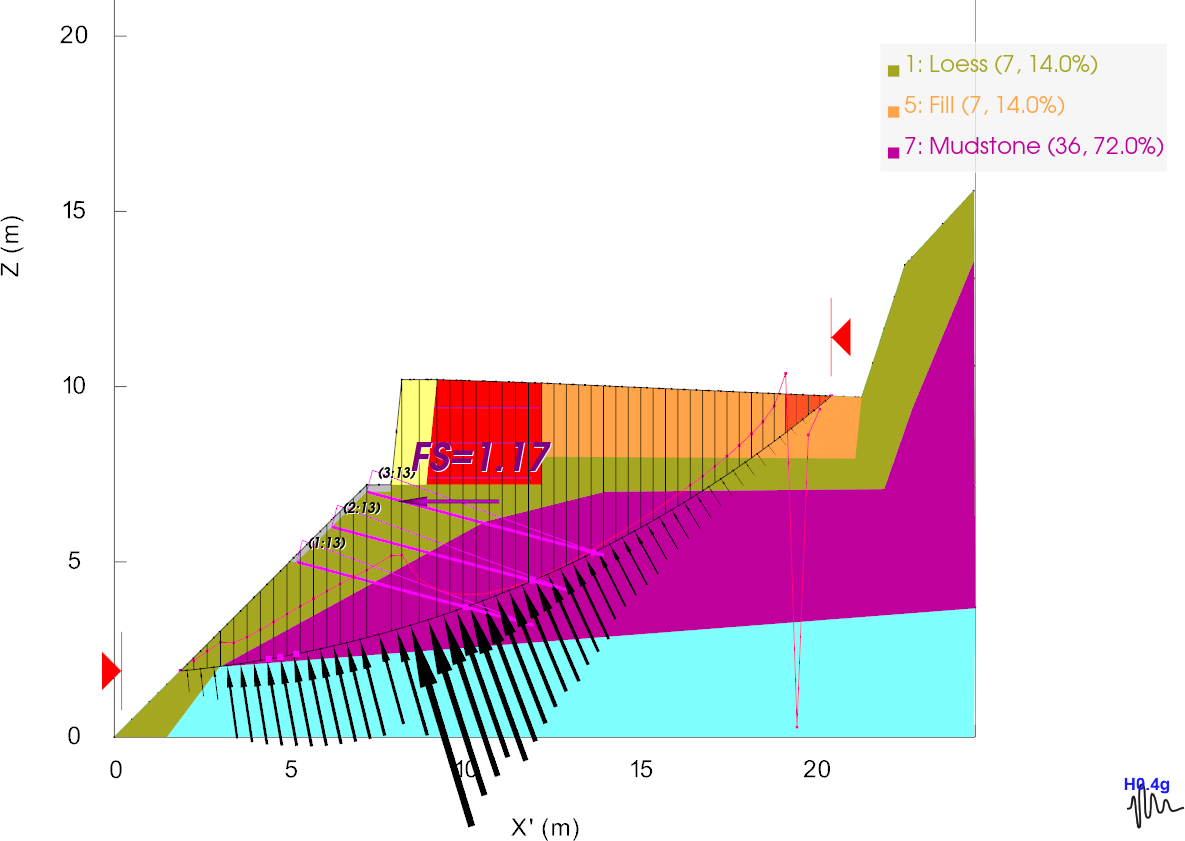
To confirm the SLOPE/W analysis, we carried out the same 2D analysis in TSLOPE (Figure 3). We used Spencer’s method of analysis, as it provides complete force and moment equilibrium. Figure 3 shows the normal forces acting on the base of the slices (black arrows), and the line of thrust (red line).
There are two aspects of this analysis that we needed to address; the line of thrust departing from the slide body, and an area of tension near the crest of the slope (red slices). These were corrected by modelling a 0.5m deep tension crack, with only insignificant change in computed factor of safety. Our calculated factor of safety (1.17) compares very closely with the SLOPE/W result of 1.20, as shown on Figure 1.
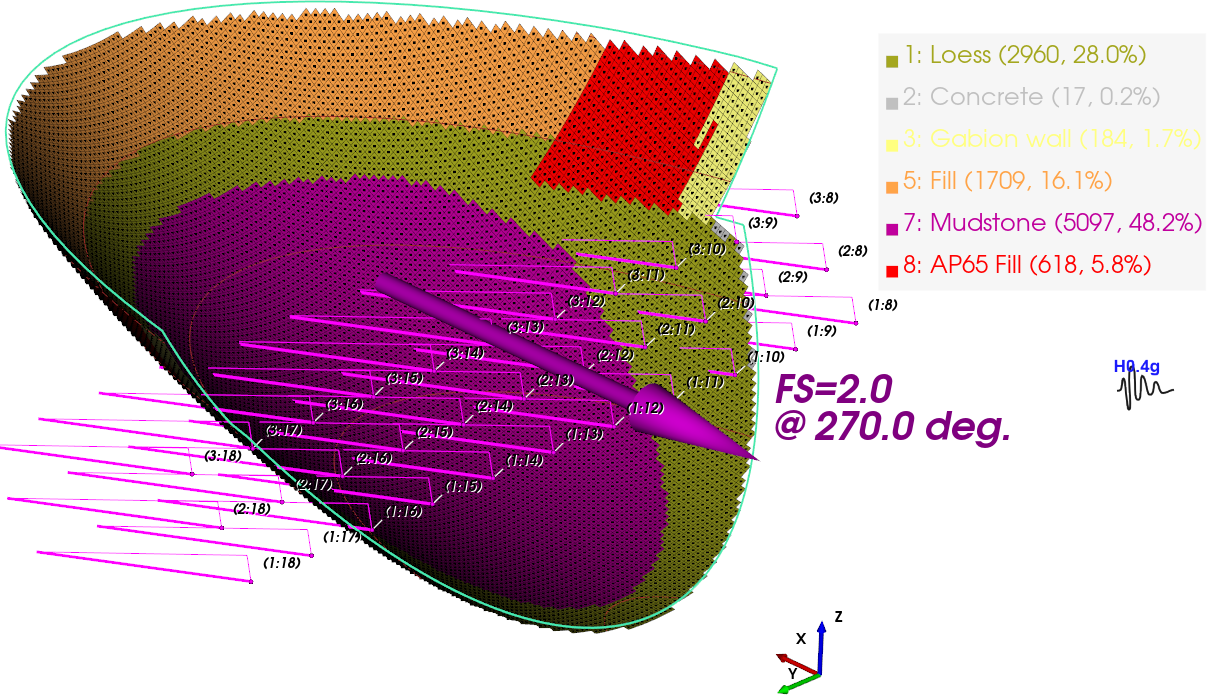
The failure surface shown on Figure 3 is a circle (in 2D) however TSLOPE represents this as a three dimensional object, i.e. a sphere. This sphere can then be used as a failure surface in a 3D slope analysis. However, since we rarely observe spherical failure surfaces, an ellipsoid was utilised as a more credible shape. For this example, we have arbitrarily modified the spherical surface by halving the dimension of the sphere in the y direction.
Figure 4 shows the results of a 3D analysis, generated starting from the information in Figure 3, i.e. the 2D situation. In 3D, the slope is discretised as vertical columns, the equivalent of slices used in 2D analyses.
Figure 3. TSLOPE 2D slope case
Figure 4. TSLOPE 3D slope case, failure surface with material colours at base of columns
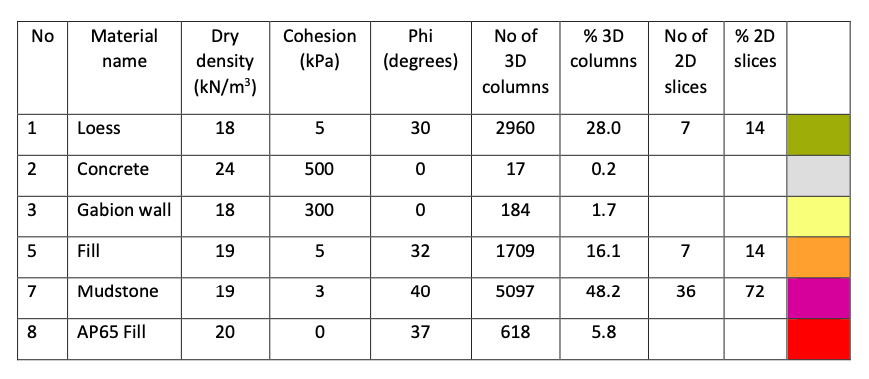
Table 1: Material properties
This example shows what we call the “weak layer effect”. That is where the 2D analysis does not take account of higher strength materials that are above the 2D failure surface, and thus provide no shear resistance, but must be intersected by the sides of the 3D failure surface, generating additional resistance. This is indicated in Table 1, where the gabion wall, AP65 fill, and concrete are not providing resistance in the 2D analysis. The relative contribution to stability of the other materials also changes between 2D and 3D.
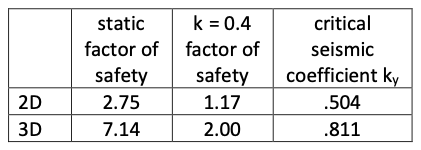
We have carried out other stability analyses, as summarised in Table 2. As expected, there is a significant increase in pseudostatic factor of safety moving from 2D to 3D analyses. The critical seismic coefficient, ky was also calculated, that is the seismic coefficient that reduces the factor of safety to 1.0. Substantial difference exists between the 2D and 3D cases.
Table 2: Summary of TSLOPE stability analysis results
3. Discussion
The 2D and 3D limit equilibrium analyses that we have presented show that a 2D analysis can be considered conservative, with the yield acceleration calculated nearly 60% higher in the 3D slope case.
A similar result was obtained by McPherson (2017) who found that the yield acceleration for the Haywards site 150m west of the Wellington Fault was 0.42 (2D) and 0.61 (3D). The slope at Haywards did not have the “weak layer effect”, or any reinforcement as shown in our example. However the 3D geometry was an important part of the slope stability analysis that was not adequately represented in a 2D analysis.
Our understanding of the NSHM applied to a Wellington site away from the Wellington Fault would require an increase in ULS k from 0.27 to 0.53. With the higher seismic coefficient, it may only be possible to show an adequate factor of safety does exist with a pseudostatic analysis if we utilise a full representation of the volume of material and reinforcing elements resisting the seismic loading. This requires use of a 3D slope model.
We look forward to further discussion among our profession, and guidance from MBIE as to how we should be applying the NSHM.
4. Acknowledgments
Ian McPherson from Aurecon provided the SLOPE/W project file that was imported into TSLOPE. Peter Wood and Tam Larkin contributed helpful reviews and suggestions that have improved this paper.
References
Duncan, J.M., Wright S.G., Brandon, T.L. 2014. Soil Strength and Slope Stability. John Wiley & Sons, Inc. 317pp.
Kendal-Riches, L. 2018. The design of ground anchors and soil nails in the repair of State Highway 1. NZ Geomechanics News Issue 96. pp 70 – 81.
Kramer, S.L. 1995. Geotechnical Earthquake Engineering. Pearson 653pp.
McPherson, I. 2017. Assessment of earthquake induced lateral displacements at Transpower Hayward HVDC Link Pole 3 upgrade. Proceedings of the 1st GeoMEast International Congress and Exhibition, Sham El-Sheikh.
Pyke, R. 2016. Selection of seismic coefficients for use in pseudo-static slope stability analyses. Retrieved from https://tagasoft.com/wp-content/uploads/2017/06/Selection-of-seismic-coefficients-for-use-in-pseudo.pdf October 25, 2022
