By Robert Pyke Ph.D., G.E.
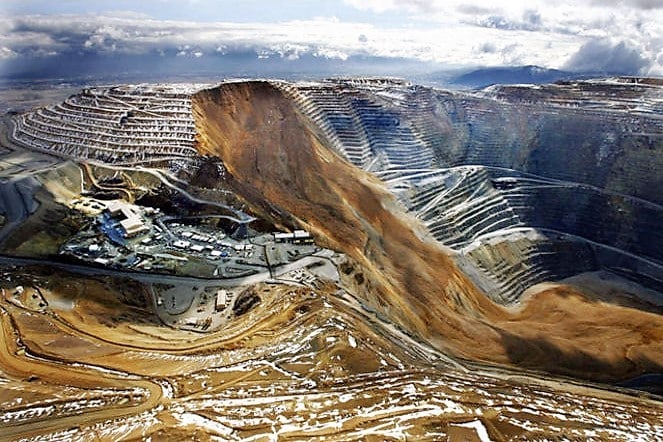
The short answer to the question “How Great Are 3D Effects in Slope Stability Analyses?” is that they can be significant in sometimes surprising ways.
This article collects examples from previous articles by the author and uses them to illustrate three different classes of slope stability problems in which 3D effects can be significant. These three classes are:
- Rock slopes, including open pit mine slopes, in which there is usually complex 3D structure behind the face. There may or may not be much difference between the factors of safety computed using 2D as opposed to 3D analyses, but clearly any analysis involving only arbitrary 2D sections is a crap shoot
- Problems involving structures such as dams or landfills where the geometry is clearly 3-dimensional. It may be of some interest to also cut 2D sections through models of such problems in order to make comparison with older analyses, but the 3D solution will always be the preferred solution.
- Problems involving slopes and structures that have a constant section over a relatively long length for which one might assume that a plane strain analysis suffices. Sometimes it does, but not infrequently it doesn’t. Problems with walls or revetments more obviously might show different results in a 3D analysis, but even in homogeneous slopes there can be significant “end effects” because the slide is of finite length and does not involve the entire length of the slope.
The third class of problems also introduces the question of how best to model piles or walls in “global stability analyses” and this article makes some important comments on the question.
The examples that are included in this article were all constructed using the computer program TSLOPE which has the advantage that it can with equal ease handle all the above three classes of problems. A 3D model can be constructed from the outset and then arbitrary 2D sections can be cut through the 3D model, or the user can start with a 2D section that can then be extruded to make a 3D model.
Rock Slopes, Including Open Pit Mine Slopes
Detailed examples are not included in this article, but a nice example can be found at Round Hill Open Pit Case study Again, there is usually complex 3D geologic structure behind the face so the first step is to conduct a thorough field investigation which may include both surface imaging and mapping, and subsurface drilling. These days the next step is usually to construct a 3D geologic model using modelling tools such as Vulcan, Leapfrog or MineSight. The pertinent geometry and properties can then be imported into a program such as TSLOPE. A program such as TSLOPE will then automatically determine the direction of sliding that has the lowest computed factor of safety. In those cases where a low factor of safety is indicated, various real-time monitoring tools are now available to confirm the results of the analysis and to provide warning of incipient failure. Thus, integrated 3D exploration, analysis and monitoring can help optimize open pit mining operations in particular, but can also be used to optimize both safety and economy on other critical rock slopes such as highway and railroad cuts.
Inherently 3D Slope Stability Problems
These may involve convex or concave slopes but the more dramatic examples usually involve landfills or dams where the fill has an obvious 3D shape. 3D geometry can either decrease or increase the factor of safety relative to the 2D section which has the lowest 2D factor of safety.
Less commonly, the factor of safety can be reduced where there is a greater contribution to the driving forces from a three-dimensional backslope relative to the resistance to sliding provided by the floor and toe areas of the potential sliding mass. This is illustrated in the first example below. More commonly, the 3D factor of safety will be higher, and perhaps much higher, than any 2D factor of safety because of the “abutment effect”. This is illustrated in the second example below.
Kettleman Hills Landfill Failure
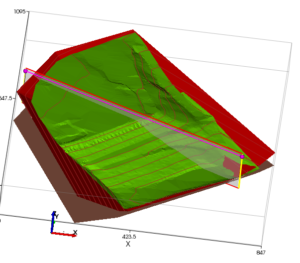
An early example of the analysis of 3D effects on real world problems was provided by the failure of the liner system at the Kettleman Hills hazardous waste landfill, reported by Mitchell et al. (1990) and Seed et al. (1990) and summarized and updated by Duncan, Wright and Brandon (2014, pp. 32 and 282). As may be seen in Figure 1(a), the initial landfill was placed against liners on one side and one end of what was to be a completely lined basin. Because the liner had not been completed on the left-hand side of the basin, which is at the top of the figure, the landfill had a partially free face on that side, as well as on the front.
Figure 1(a) – 3D View of Kettleman Hills Landfill
When the landfill had reached a maximum height of 90 feet, a slope failure occurred with horizontal and vertical movement of up to 14 and 35 feet. Subsequent investigations suggested that the basic failure occurred along a wetted HDPE liner compacted clay layer interface which resulted from the clay layer having been placed wet of optimum moisture content and then subsequent consolidation with drainage restricted by the HDPE liner. The extent of this wetted interface condition was not clear, thus Seed et al. conducted stability analyses for both partial and full wetting of the base. For a number of 2D cross sections, Seed et al. obtained factors of safety of 1.2 to 1.25 for the partial base wetting case and 1.10 to 1.15 for the full base wetting case. For the diagonal 2D cross-section that is shown in Figures 1(a) and (b), drawn in the direction of movement indicated by a 3D analysis, TSLOPE gives 2D factors of safety of 1.21 and 1.22 for the Ordinary Method of Columns (OMC) (for an explanation of the OMC, see https://www.linkedin.com/pulse/ordinary-method-columns-alternative-limit-equilibrium-robert-pyke) and Spencer’s Method respectively, assuming full base wetting.
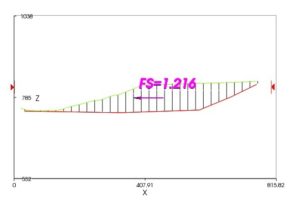
Figure 1(b) – Analysis of 2D Section by Spencer’s Method
Table 1 – Calculated Factors of Safety
Seed et al. then explored 3D effects by conducting what they described as a “force-equilibrium analysis” using five blocks and obtained 3D factors of safety of 1.08 and 1.01 for the partial and full base wetting cases. Assuming full base wetting, TSLOPE gives factors of safety of 1.00 and 1.05 by the OMC and Spencer’s method respectively, as listed in Table 1. Thus, making normal judgments about the appropriate 2D section to analyse, the 3D factor of safety appears to be 10-20 percent below the 2D factor of safety. The reason for the lower 3D factor of safety can be explained in either of several ways. One way is to say that because of the longer back slope relative to the base area, there is more “push” from the slope relative to the resistance provided by the base. Alternately, one can view this as a problem where the “end effects” are less than they would be in a long slope with a constant 2D cross section. The 10 to 20 percent difference may or may not be a big deal from the design point of view because the failure to recognize the lower wetted interface strengths was a larger problem, but, again, it is significant in back calculating properties from the failure and understanding the failure mechanism.
Duncan et al. summarized subsequent studies which tended to play down the significance of the 3D effects pointing to other uncertainties and noting that it was possible to find 2D cross sections that showed factors of safety of less than one, suggesting that there might have been progressive failure. However, these cross sections had at least some “end effects” and could not fail on their own. And, at least some of the guess work can be eliminated by conducting a 3D analysis in the first place.
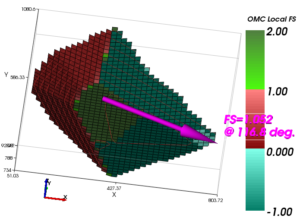
Figure 1(c) – Analysis Showing Local Factors of Safety from OMC
If this is done using the OMC, a single analysis can also calculate the local factors of safety, as shown in Figure 1(c) indicating locations where progressive failure might start, and repeat analyses can be conducted as desired to follow progressive failure.
However, the number of cases where 3D effects lead to lower factors of safety are not as dramatic and are limited in number compared to the cases where 3D effects increase the factor of safety, as shown in the next example.
Puente Hills Canyon 9
A more graphic example of the positive effects of 3D geometry is provided by the Puente Hills Canyon 9 landfill of the Sanitation Districts of Los Angeles County, which triggered the development of the 3D approach used in the current version of TSLOPE.
Canyon 9 represented an expansion of an existing landfill so that one side of the expanded facility consisted of existing compacted municipal solid waste (MSW) that sat on natural ground without a liner. However, new regulations required that both the floor and the slopes of the expansion be placed on a single HDPE liner. Over the floor the HDPE liner was placed on top of a compacted clay layer that had a lower strength than the interface of a roughened HDPE liner and the MSW, so that sliding along the floor was controlled by the undrained strength of the clay layer (c = 250 psf; φ = 13.5 degrees). However,a smooth HDPE liner was placed directly on the slopes excavated in the in situ soft rock and the weakest interface was judged to be the contact between the liner and the MSW (c = 0; φ = 10 degrees) because the liner was anchored into the in-situ material on a number of benches.
Thus, there were three zones of the base of the landfill that had different strengths for the purpose of analysis, although 2D analyses of sections that passed through the mouth of the canyon, such as shown in Figures 2(a) and (b), suggested that the critical 2D section involved sliding only on the floor and the slopes and did not involve the existing MSW (assumed at the time to have a shear strength of c = 0; φ = 30 degrees). However, when construction was well advanced, a leading geotechnical consultant who was brought in to perform the analyses of slope stability that were required by regulators, found, not surprisingly, that the conventional 2D factor of safety of a section passing through the mouth of the canyon was only 1.22 – less than the required minimum – and, more surprisingly, found that an early, commercially available 3D slope stability program gave similar results.
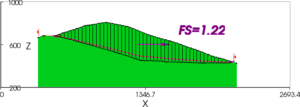
Figure 2(a) – 2D Cross Section through Mouth of Canyon
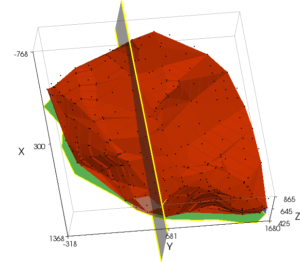
Figure 2(b) – 3D View of Base of Canyon
The owner, justifiably, threw a flag at this point because it was evident that in a “bottleneck” canyon like this, as shown in Figure 2(b), the 3D effects had to be significant with the mouth of a canyon acting like the abutments of a good arch dam site. The upshot of this was that another geotechnical consultant brought in the writer to develop and use a program that more properly modelled the 3D geometry and its effects. The original program used a horizontal force equilibrium solution which Los Angeles County had for some years required geotechnical consultants to perform by hand. The properties cited above were assigned over the basal surface as shown in Figure 2(c), where the red zone is the floor of the canyon, the green zone is slopes lined with HDPE, and the blue zone is the adjacent MSW. Using the original program, a factor of safety of 1.92 was obtained, more than satisfying the regulatory requirement of a factor of safety of 1.5. The updated program, now called just TSLOPE, gives a factor of safety or 1.70 using the OMC and, by chance, gives a factor of safety of 1.93 using Spencer’s Method.
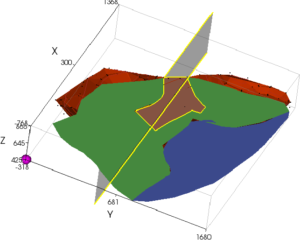
Figure 2(c) – 3D View Showing Zones with Different Properties
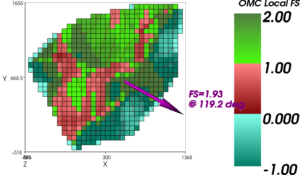
Figure 2(d) – Local Factors of Safety in 3D Analysis
As in other problems, the higher factor of safety by Spencer’s Method is consistent with the implication of a rigid body which is restrained even more by the bottle-neck than is the OMC model which assumes that each column can move independently. The fact that the Los Angeles County horizontal force equilibrium method and Spencer’s method give almost identically the same factor of safety for this problem is a fluke, rather than an indication of a fundamental truth. The local factors of safety computed using the OMC are shown in Figure 2(d). In this figure the blue colours indicate a negative factor of safety or, in other words, a reverse slope. Basically, the abutments and the floor of the canyon are holding the MSW up while it tries to slide down the back slope. The 2D factors of safety for the section shown in Figure 2(a) are 1.20 by the OMC and 1.22 by Spencer’s Method, so that the 3D analyses show increases of 42 percent and 58 percent over the 2D analyses.
The fact that there is a significant 3D effect for this problem, or for a dam in a narrow canyon, should come as no surprise, but, again, what turns out to be surprising is that there can also be significant 3D effects in real life problems where it would normally be thought that a 2D analysis of a slope with a constant cross section suffices. This can happen where a 2D potential failure surface dives under a wall or a revetment whereas in reality the failure has to cut through the wall or revetment, as shown in the following examples.
Slope Stability Problems with a Constant 2D Cross-Section
This is the class of problems that perhaps has the most surprising 3D effects. As noted in the introduction, there can be “end effects” even in homogeneous slopes. The magnitude of these “end effects” varies depending on whether the slope is cohesive or cohesionless, with cohesive slopes generally showing greater “end effects” (see Baligh and Azzouz, 1975, and my previous article https://www.linkedin.com/pulse/3d-effects-slope-stability-analyses-robert-pyke).
The reason that slope failures usually occur over a finite length along even a slope with a constant 2D cross-section, is that soils and rock masses rarely, if ever, have perfectly uniform strengths and water conditions. Therefore, failures are initiated at the weakest point, just like a chain breaks at its weakest link. That is why in conventional geotechnical engineering practice we normally select soil strengths which we believe are on the low side of average or are lower bound values, as well as the worst water conditions. That is not necessarily conservative – it is a logical thing to do. But it has not generally been recognized that the 3D effects associated with failures that have a finite length along the slope might mean that the calculated factor of safety using appropriate soil properties and water conditions and a 2D plane strain analysis, might be excessively conservative in some, or even many, cases. This may not matter that much in some designs, but in others it contributes to the excessive conservatism which is causing project costs to balloon out of sight. It is also critical in those cases where the soil or rock mass strength are back-calculated from a failure. Omission of 3D effects from the back-calculation can lead to estimates of shear strength which are too high, with the result that the design of remedial measures is unconservative.
But the most dramatic difference between 2D and 3D analyses occurs when there is a wall or revetment as part of a slope. For situations where the 2D potential failure surface dives down below the revetment or wall its impact on the analysis is negligible. But a 3D potential failure surface has to cut through the revetment at least twice, once at either end of the potential failure surface. And, if there is a wall that extends down through a weaker layer to a strong layer, the potential failure surface has to cut through the wall along a long arc. The first of these conditions is illustrated in the next example and the second is illustrated in the following example.
Treasure Island
Treasure Island, a man-made island in San Francisco Bay, was originally intended to serve as an airport, but, after the completion of the 1939 World’s Fair, the island was taken over by the US Navy. It is presently being redeveloped for civilian use. The sand fill that was placed to form the island will be densified to mitigate possible liquefaction and the final grades will be raised up to 5 feet to allow gravity flow of stormwater for the foreseeable future. Prefabricated vertical drains and surcharging will be used to limit future settlement of the underlying young Bay Mud. The cross section shown in Figure 3(a) and the soil properties are taken from publicly-released bid documents.
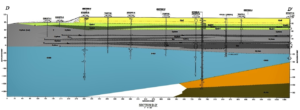
Figure 3(a) – Section D-D’
The shoal materials which underlie the sand fill are clayey sands that generally contain from 15 to 30 percent fines. These materials are not liquefiable in any conventional sense and they were very resistant to densification by vibratory loading in trials that were performed at the site. Thus, with the young Bay Mud consolidated not only under the weight of the existing fill but under additional surcharge loads and the rock revetment is composed of free-draining, competent rock, there is no obvious concern about shoreline stability at this site, even given its proximity to the San Andreas and Hayward faults.
Nonetheless, in the bid documents there were brief descriptions of work done by the project’s geotechnical consultant using simplified methods of analysis which indicated a potential shoreline stability problem. This raises the question of whether there is any better screening analysis that is appropriate for this site. The short answer is yes, there is. As explained by the late Harry Seed in his Rankine Lecture (Seed, 1979), for materials that do not undergo a loss of strength and stiffness as a result of cyclic loading, pseudo-static analyses are not too bad. And pseudo-static analyses are also required to compute the yield acceleration (the seismic coefficient that reduces the factor of safety to unity – the factor of safety for a specified seismic coefficient can then be derived from this) for use in the various simplified methods to compute deformations.
TSLOPE was used to compute the static factors of safety and the yield acceleration for both 2D and 3D slip surfaces. For Section D-D’, when a circular slip circle is transformed to a spherical or ellipsoidal slip surface, two things happen. One is that the slip surface now has to cut through the rock revetment, rather than diving under it – this will increase the factor of safety. The other is that relatively more of the slip surface will be in the young Bay Mud – this might either reduce or increase the factor of safety, depending on the strength of the Bay Mud relative to the other materials that are involved.
For the “seismic” loading case undrained strengths were used for all materials below the water table, except for the rockfill in the revetment. These strengths were also corrected for rate of loading effects in order to represent the short rise time of an earthquake pulse. The critical circular slip surfaces obtained using Spencer’s Method and the “static” and “seismic” properties are shown in Figures 3(b) and (c).
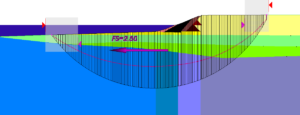
Figure 3(b) – Section D-D’ Static Analysis
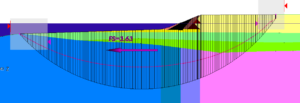
Figure 3(c) – Section D-D’ Static Analysis with “Seismic” Properties
Both these figures are for “static” analyses without the application of a seismic coefficient. The critical circular slip surface obtained in the “static” analysis with “seismic” properties was then used in subsequent searches for the yield acceleration.
The critical 2D failure surface was also used as the basis for constructing three 3D failure surfaces, as shown in Figure 3(d). The centre 3D slip surface is a sphere, which has an aspect ratio of 1.0. In addition, there are two further ellipsoids that have aspect ratios of 0.5 and 2.0. The larger the aspect ratio, the more the 3D solution approaches the 2 D solution.
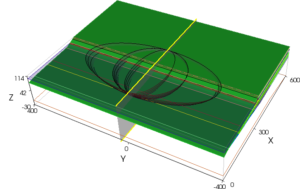
Figure 3(d) – 3D Potential Failure Surfaces
Table 2 – 2D and 3D Factors of Safety and Yield Accelerations
The results are shown in Table 2. Again, the reason that the 3D factors of safety are higher than the 2D is that in 3D you must cut through the revetment, rather than diving under it as happens in 2D. Of the four cases, the one with the aspect ratio of 0.5, which gives the highest factor of safety, is probably the most like a typical landslide.
As expected for a slope that has been stable for many years and would have been at greatest risk at the end of construction, the static factors of safety are healthy enough and the yield accelerations are great enough relative to the design peak ground acceleration of 0.46g to suggest any deformations under earthquake loadings would be quite small.
This example strongly suggests that simplified analyses using conventional procedures and 2D slope stability analyses can be unnecessarily conservative in some cases, and as in this particular case, suggest that there is a problem where no problem actually exists.
Sheet Pile Wall
In the previous example significant 3D effects were shown in the analysis of a revetment at Treasure Island. In that case, although part of the critical 3D failure surface passes under the wall or revetment, the 3D failure surface also has to cut through the wall or revetment twice, and the equivalent 2D failure surface does not cut through it at all, but dives under it.
However, what if the 2D failure surface cannot go deep enough to pass under a wall but must go through it? Such a situation is illustrated in Figure 4(a).
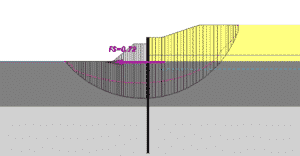
Figure 4(a) – Sheet pile bulkhead with wall given properties of soil
This is a hypothetic problem using San Francisco Bay Mud as the native foundation material but it is based on a real-life example elsewhere. In the hypothetical example, a steel sheet-pile bulkhead is driven into the underlying Old Bay Clay and then a rock berm on the outside and a sand fill on the inside are brought up simultaneously. The configuration shown in Figure 4(a) includes a surcharge fill in order to speed consolidation of the Bay Mud under the sand fill using prefabricated vertical drains. In analyses of this class of problem using standard method of slices analyses, it is commonly assumed that the sheet-piles are not thick enough to have any influence on the global stability so they are ignored. In this example the sheet piles were included in the analysis as a 2-foot wide slice but this slice was initially given the properties of Bay Mud to simulate ignoring the wall. It can be seen in Figure 4(a) that the critical circle obtained using Spencer’s method of analysis does not penetrate the Old Bay Clay but is located near the bottom of the Bay Mud layer. The computed factor of safety, as shown on the figure, was 0.72, indicating a global stability problem.
However, common-sense should suggest that a slope stability type failure cannot occur in this case because the failure would have to shear through the steel wall. That can easily be checked by included the shear strength of the sheet-pile wall in this analysis. In this case the shear capacity of the sheet piles was distributed over the 2-foot wide slice but it is still approximately 1,000 times greater than the shear strength of the Bay Mud.
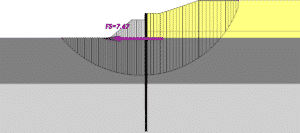
Figure 4(b) – Sheet pile bulkhead with wall given properties of steel
The computed factor of safety now becomes 7.67, as shown in Figure 4(b). As will be enlarged on subsequently, this does not mean that there may not still be a wall deflection problem, but there is no global stability problem.
However, the factor of safety against a global stability failure is still underestimated because the 2D analysis does not take account of the fact that the potential failure surface now has to cut through the wall around an arc, rather than just at two locations, as in the examples where the 2D failure surface dives under the wall or revetment. This can be readily demonstrated using TSLOPE. A 3D view of the problem in which the circular slip surface is transformed to a spherical slip surface is shown from above in Figure 4(c) and from the back in Figure 4(d). The arc around which the sphere intersects the wall can be seen in Figure 4(d).
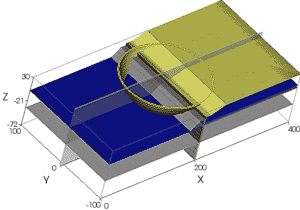
Figure 4(c) – Sheet pile bulkhead with 3D failure surface
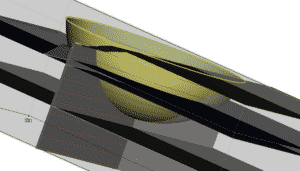
Figure 4(d) – View of 3D failure surface intersecting wall
The computed factor of safety is now 53.6, as shown in Figure 4(e).
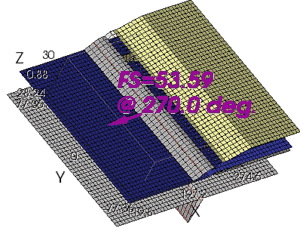
Figure 4(e) – Result of 3D slope stability analysis
As noted previously, this does not mean that there may not still be a wall deflection problem, but there is clearly no global stability problem. The wall deflection problem can be addressed in various ways but the optimum approach may be represented by the forthcoming TAGAsoft program TPILE, which is similar to the well-known program LPILE, but includes special nonlinear springs to represent the earth pressures against a wall, rather than using p-y springs with arbitrary p-multipliers, as seems to be common, but unwise, in current practice. To structural engineers it is inconceivable that there could be a global stability problem, as they recognize from the outset that this is a wall deflection problem, and are mystified why geotechnical engineers should view this as a slope stability problem. But neither structural engineers nor geotechnical engineers have been very good at developing simple but robust methods of analysis and computer programs for the general class of soil-structure interface problems.
Additional Comments
This example prompts two further observations about “global stability analyses” of slopes involving piles or walls.
- It is becoming more common for geotechnical engineers to try to introduce the effect of either isolated piles or walls into slope stability analyses by applying forces or pressures developed using a separate analysis of the pile or wall behaviour using a program designed for the analysis of single pile response to lateral loading. This is fine if the pile program is used to determine an estimate of the ultimate resistance provided by isolated piles for the case when a slide tends to flow around the piles. The engineer can then compare that resistance with the shear capacity of the piles and add the lower of these two values to the “resisting forces” in a slope stability analysis. This is not inconsistent with conventional method of slices or columns stability calculations, whether they be strictly limit equilibrium methods or not. But to add the resistances computed by a pile program for some arbitrary deformation, makes little or no sense. This is mixing apples and oranges. Method of slices or columns stability analyses consider only failure and do not pretend to compute deformations. And, to do this assuming arbitrary deformations of a wall and p-multipliers which are conjured up to convert p-y springs developed for isolated piles to apply to a wall, all without considering the three-dimensional nature of the problem, makes even less sense.
- One might also reasonably ask, why not address both the global stability problem and the wall deflection problem using a single program such as FLAC? The short answer is that this is more complicated than it might appear at a first glance. FLAC, and similar programs, are basically continuum analysis programs in which the wall has to be modelled by solid elements and it is difficult to impossible to simultaneously match the shear capacity and the bending stiffness of the sheet-piles with a stack of solid elements, especially in a 2D analysis. More sophisticated models or programs appear to be required to capture critical elements of the behaviour of soil-structures systems and interfaces in a single analysis.
Conclusions
- 3D geometry can occasionally reduce the calculated factor of safety, but more usually it increases the calculated factor of safety. The increase is up to as much as 60 percent in the examples that are shown without revetments or walls, and in the order of an order of magnitude greater in problems with a wall that penetrates through a weak layer into a stronger layer, forcing any shearing failure through the wall to occur around a long arc.
- You will never know how much difference it makes on your project unless you have the tools to check such effects.
- It is still true that even with the best tools, the engineer still must exercise his or her own judgment! It is also common-sense that any drainage systems and reinforcement have to be maintained. A good analysis will not prevent failure if the slope is not maintained, but a better analysis is a good starting point.
References
Baligh, M.M., and Azzouz, A.S., “End Effects on Cohesive Slopes”, Journal of Geotechnical Engineering, ASCE, Volume 101, No. 11, 1975
Duncan, J.M., Wright, S.G. and Brandon, T.L. “Soil Strength and Slope Stability, 2nd Edition”, ISBN: 978-1-118-65165-0, Wiley, September 2014
Mitchell, J.K., Seed, R.B., and Seed, H.B., “Kettleman Hills Waste Landfill Slope Failure I: Liner System Properties”, Journal of Geotechnical Engineering, Volume 116, No.4, pp. 647-668, 1990
Seed, H.B., “Nineteenth Rankine Lecture: Considerations in the Earthquake Resistant Design of Earth and Rockfill Dams”, Geotechnique, Vol.24, No.3, September 1979
Seed, R.B., Mitchell, J.K., and Seed, H.B., “Kettleman Hills Waste Landfill Slope Failure II: Stability Analyses”, Journal of Geotechnical Engineering, Volume 116, No. 4, pp. 669–690, 1990
oOo

