by Ian Brown D.Eng, CPEng
1. Background
In May 2016, we flew a UAV (unmanned aerial vehicle, or drone) over part of Belmont Quarry, Lower Hutt, to record detailed photographs of localised bench failures. This was to help us develop a work flow that would start with the drone photography and conclude with back analysis of the slope failure using our 3D slope analysis program, TSLOPE. 2. UAV data capture
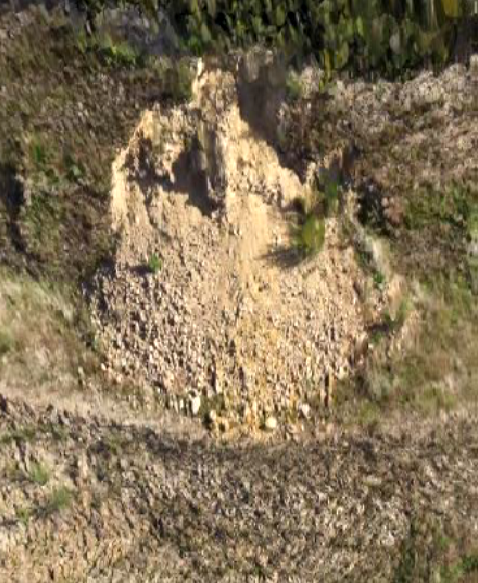
A DJI Phantom 3 Advanced UAV was flown over Belmont Quarry. A subset (34) of the large number of images were processed using Pix4D software to generate the ortho-mosaic shown in Figure 1. There was good overlap of images over the area, with more than 5 images overlapping for each pixel location.
Figure 1 Orthophoto mosaic showing area of shallow slope failure.
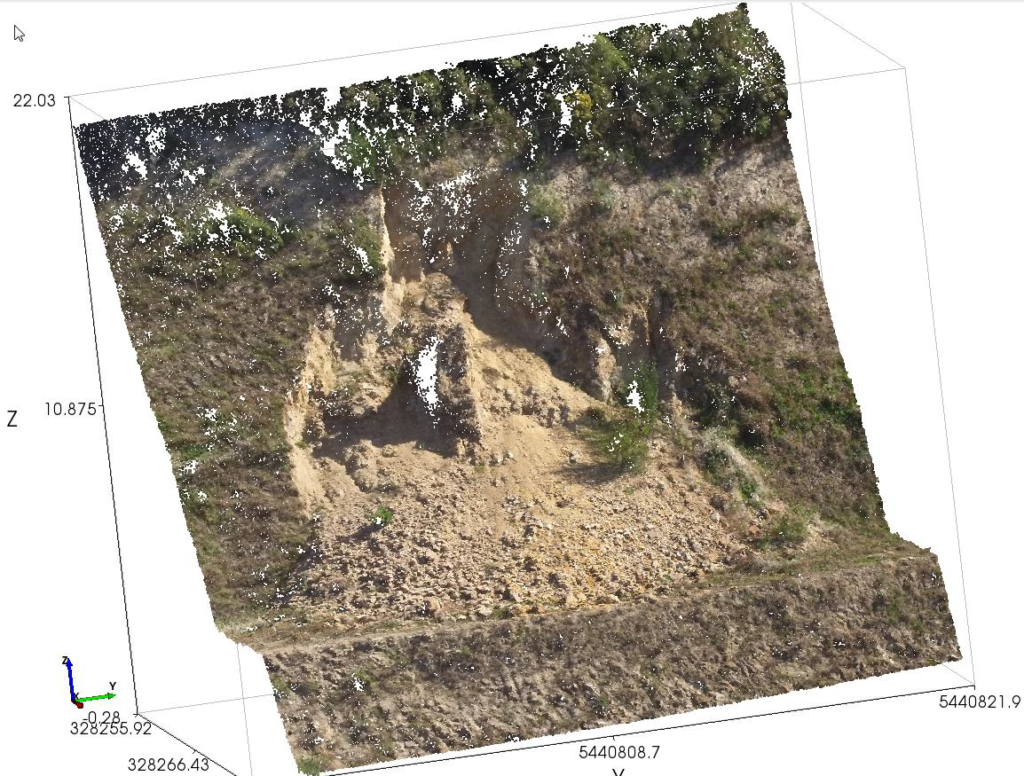
A cloud of points with values for x, y, z as well as RGB (red, green, blue values for each point) was also generated by Pix4D. The cloud of points data (1,033,537 points) were loaded into TSLOPE to assist with visualisation of the slope, as shown in Figure 2. Because of the RGB attributes of each point, a photo-like image is created.
Figure 2. Cloud of points as displayed in TSLOPE.
3. Site description
The shallow slope failure has occurred on a bench slope on the upper levels of the quarry. The quarry produces aggregate for the local construction industry from a highly indurated quartzofeldspathic sandstone, with interbedded siltstone, known locally as “greywacke”. The rock in the upper levels of the quarry is variably weathered, hence the brown colour of the rock as shown in Figure 2. Slope failures in the quarry are controlled by rock structure. There are intersecting rock fractures that form the failure surface exposed towards the top part of the slope face. The failure surface is then assumed to continue towards the toe of the slope, where it is covered by debris.
The slope failure has dimensions of about 14m height, and about 20m width at the toe. 4. Surface modelling
To provide a model that can be used to back calculate in situ strengths that applied at the time of slope failure, we need to be able to model the original topographic surface, and the failure surface.
TSLOPE, as currently available, does not have the capability to produce surfaces from clouds of points. We recommend that users access software packages that have specialised tools for working with such data.
For this example, we have used I-Site Studio, a point cloud processing package developed by Maptek Pty Ltd (www.maptek.com).
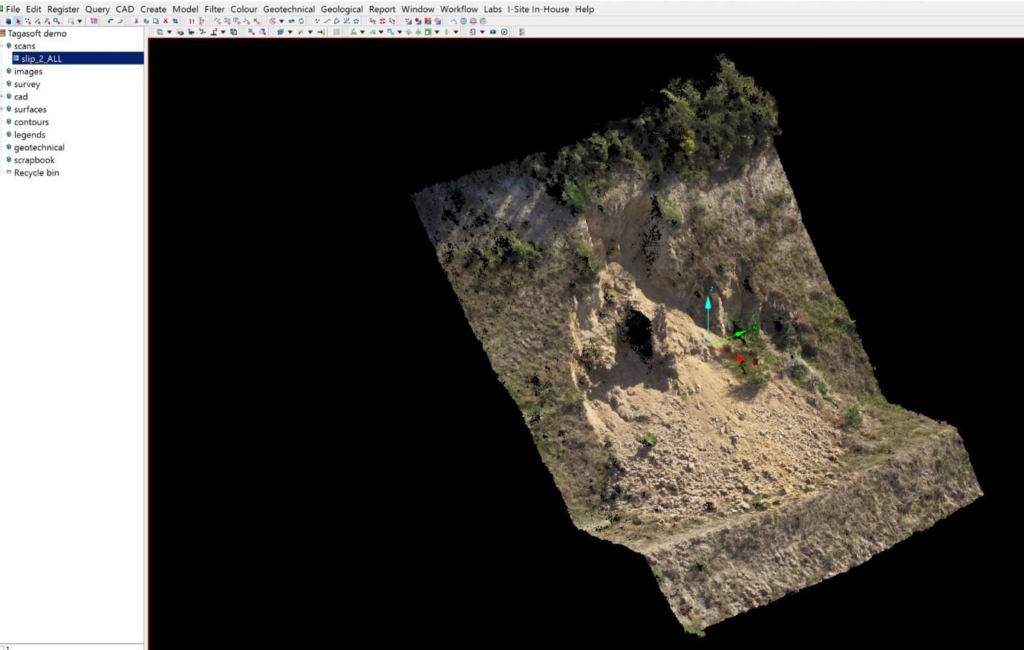
The raw UAV data were loaded into I-Site and viewed in 3D (Figure 3).
Figure 3. Raw cloud of points viewed in I-Sight.
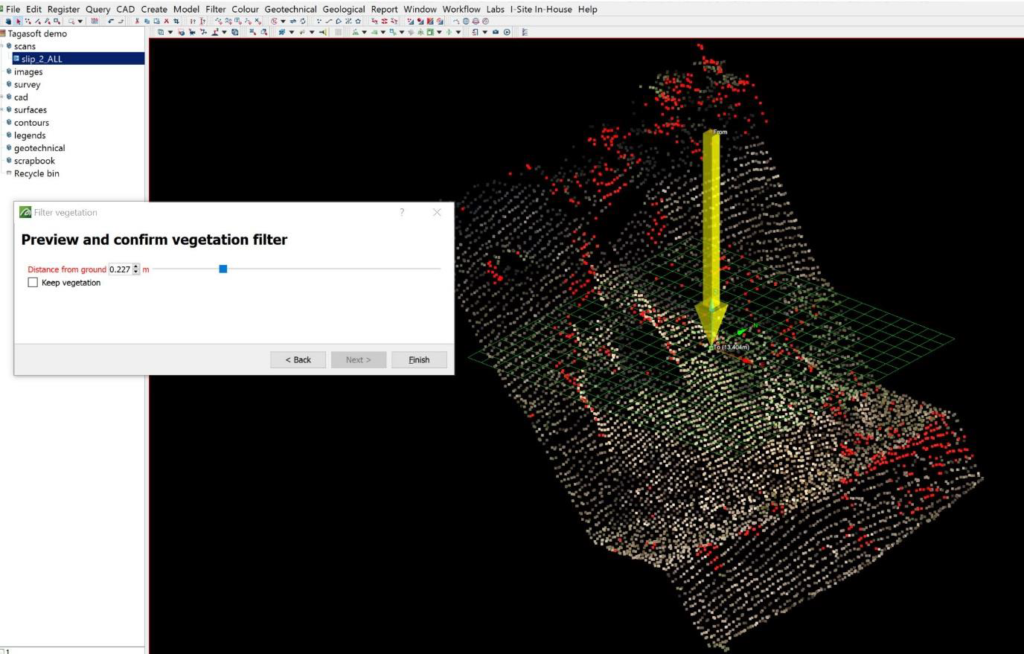
I-Sight can distinguish points that have been located on vegetation, using colour as a criteria. The software is then able to clear selected points, as shown in Figure 4, from the scene.
Figure 4. Vegetation filter applied to cloud of points.
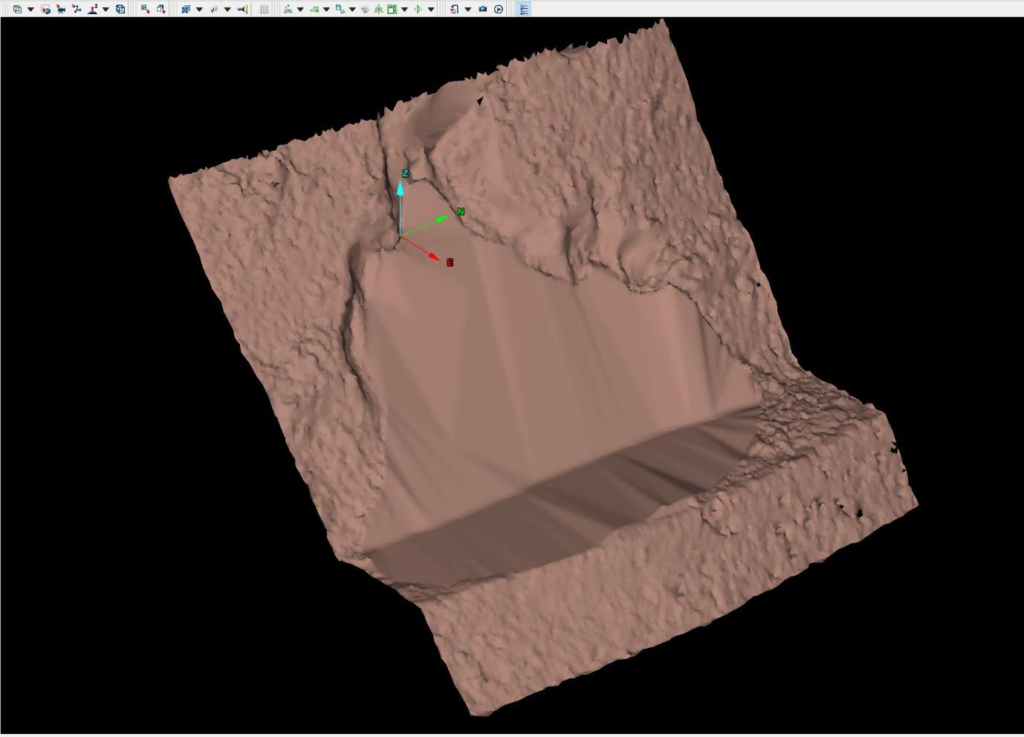
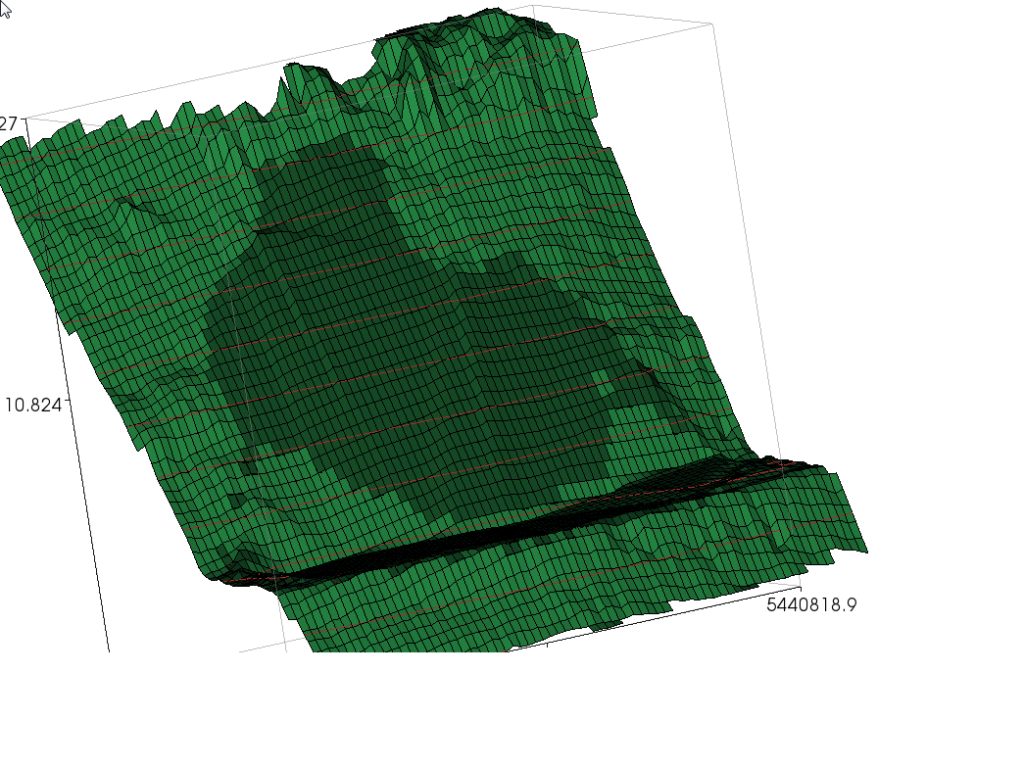
I-Sight was then used to construct the two surfaces we need to import to TSLOPE. The first is the pre-failure topography, and this was constructed by removing the points involved with the slope failure, and constructing a continuous surface across the remaining points (Figure 5).
Figure 5. Re-constructed ground surface prior to slope failure.
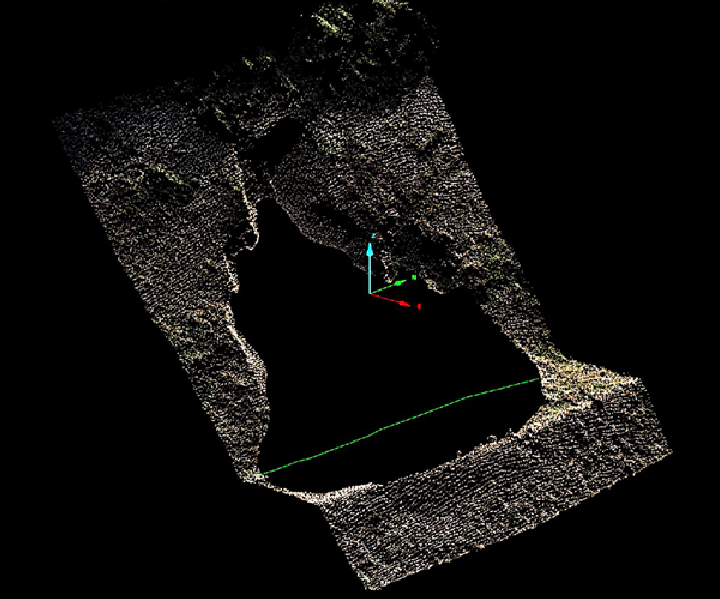
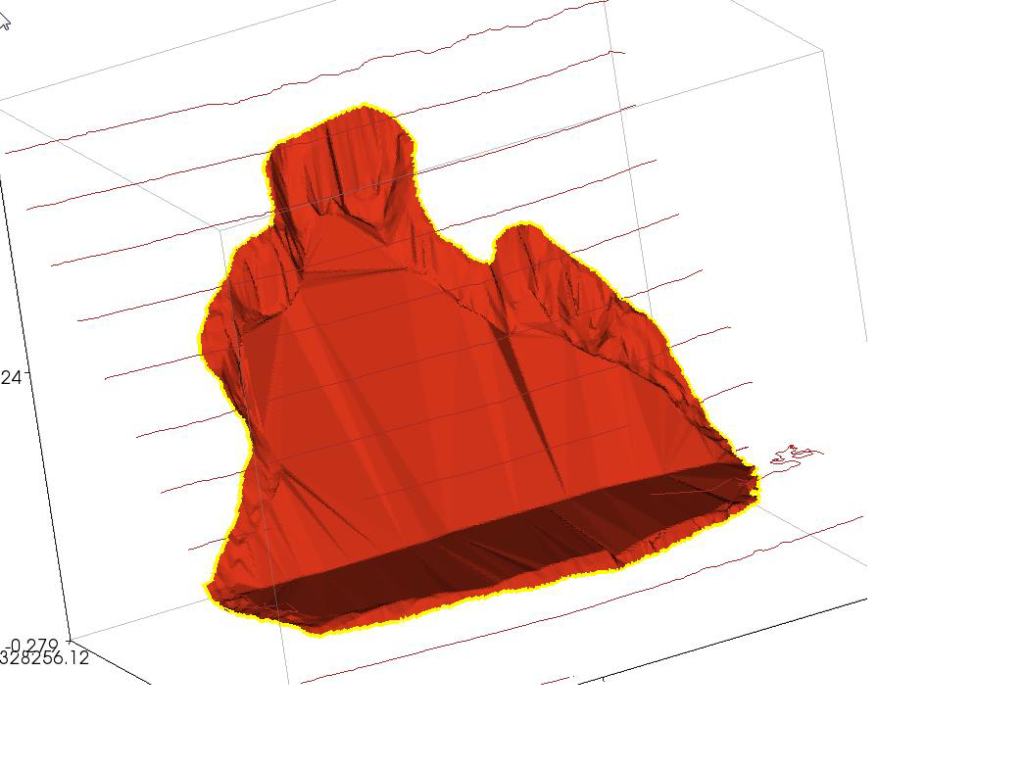
Further manipulation of the cloud of points allowed modelling of the failure surface, with the assumption that the base of the shear surface intersected the toe of the slope. This is shown in Figure 6.
Figure 6. Modified cloud of points in preparation for modelling of slide surface.
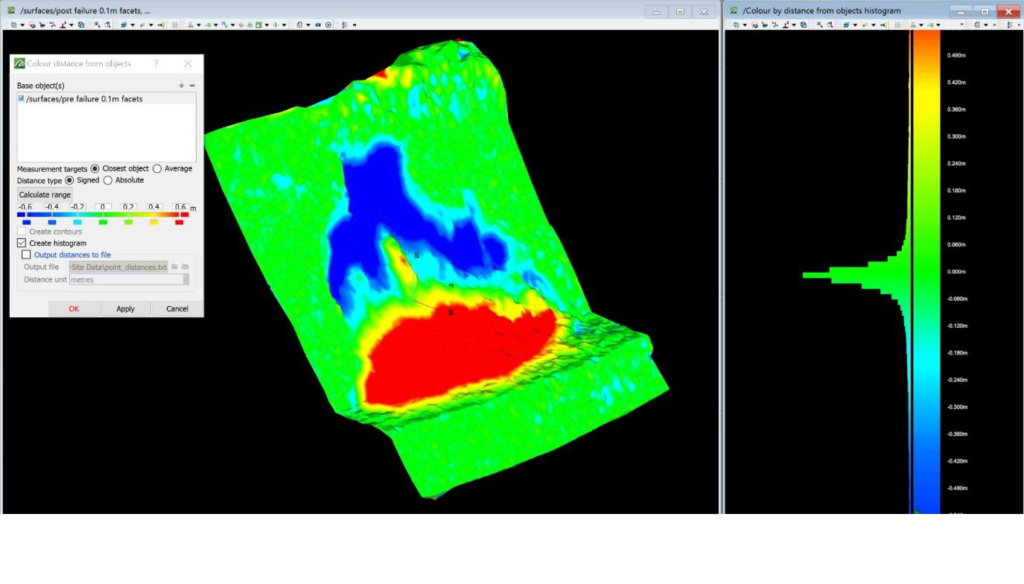
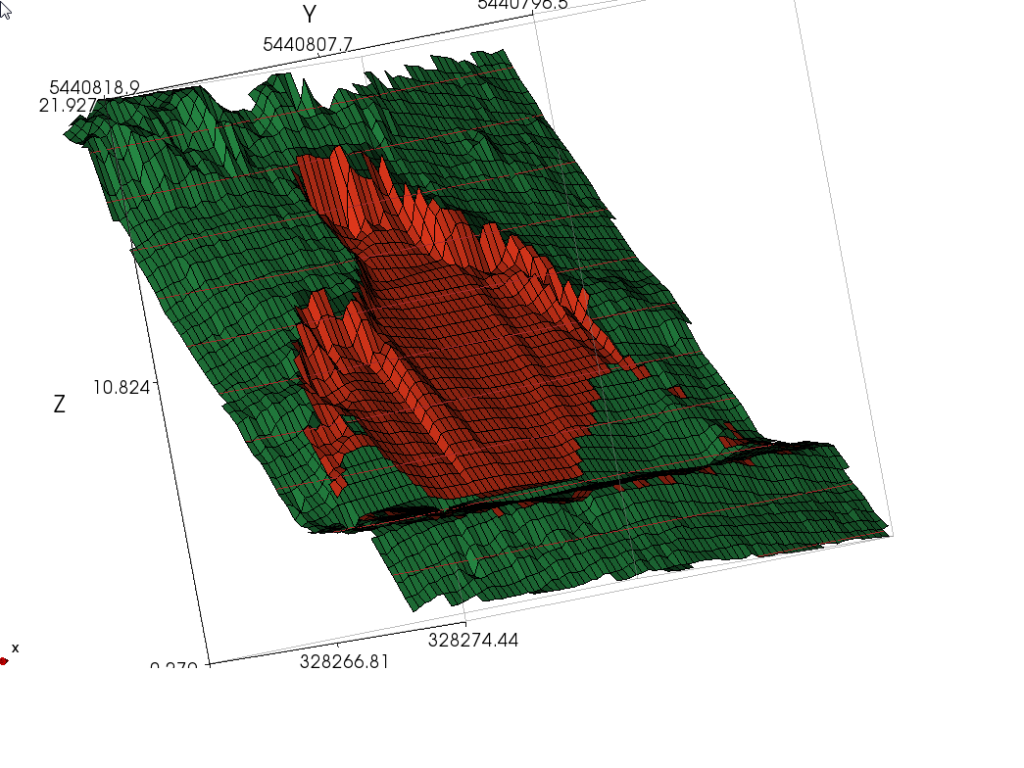
Figure 7. Comparison of pre slide and after slide topography.
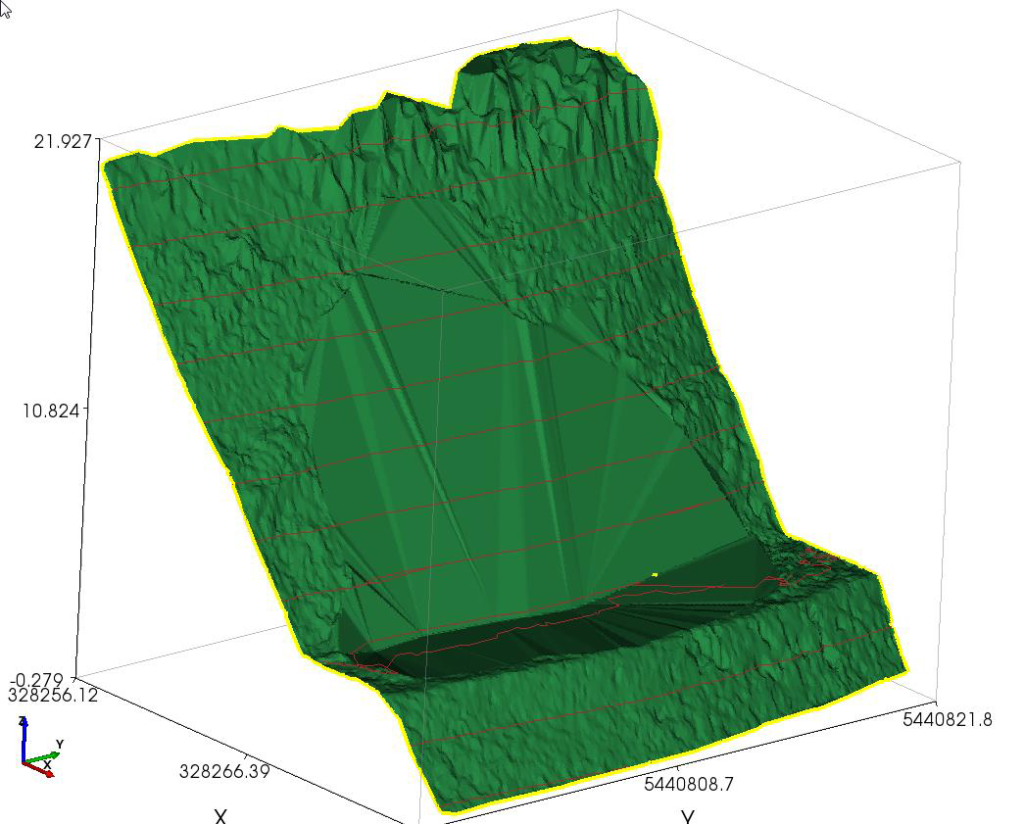
The two surfaces modelled in I-Site were then exported in .obj format.
5. TSLOPE model
The original topographic surface .obj file was loaded into TSLOPE as the Top surface, and is shown in Figure 8.
Figure 8. TSLOPE model Top surface.
The shear failure surface was then loaded into TSLOPE as a Basal surface (Figure 9).
Figure 9. TSLOPE model basal surface.
Greywacke material properties were then entered, with unit weight (unsaturated) of 20 kN/m3, Mohr Coulomb parameters – cohesion of 4 kPa, and angle of friction of 30o. These numbers were an estimate, reflecting the low stresses acting on the failure surface.
A three dimensional slope case was then defined based on the two surfaces. It is assumed that there are no groundwater pressures applying in this case.
The slope case discretises the model into vertical columns overlying the basal surface. The model was set up with 100 columns across the width of the model, as shown in Figure 10. The darker colour columns are the active columns involved in the slope stability calculations.
Figure 10. Three dimensional slope stability model showing arrangement of vertical columns.
Figure 11. View from behind the slope model, showing the Basal shear surface.
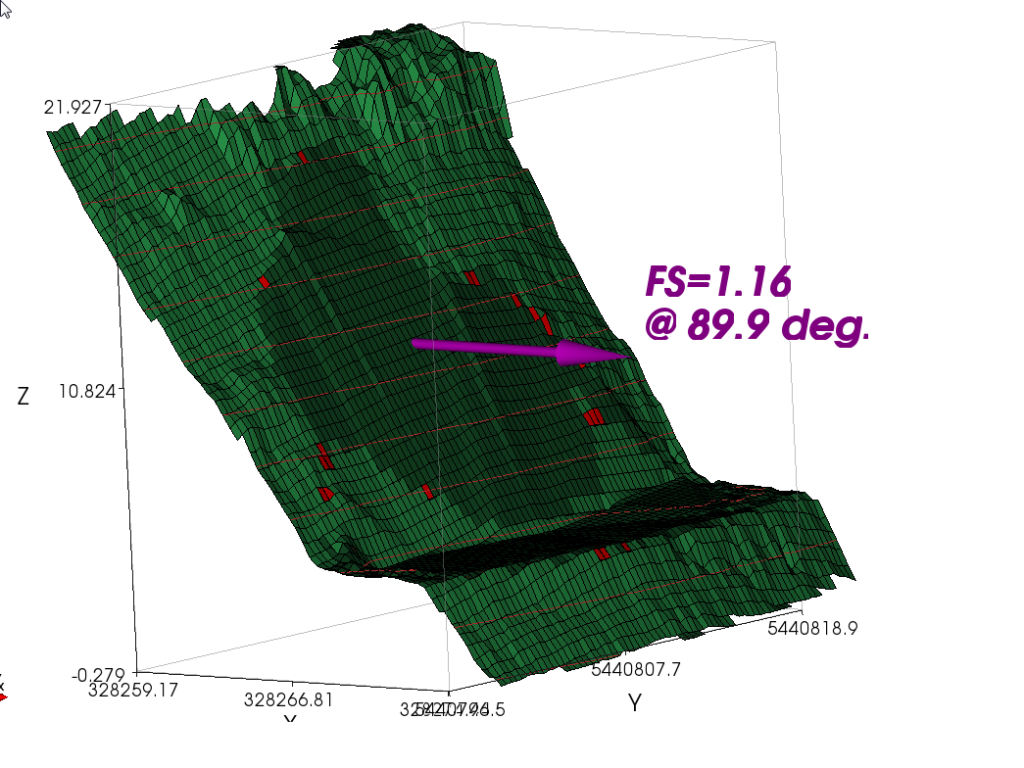
TSLOPE then provided a solution using Spencer’s method, with a calculated factor of safety of 1.16 (Figure 12). This suggests that the strengths used in the model are a little higher than would have applied at the time of failure.
Figure 12 Result of 3D analysis using Spencer’s method.
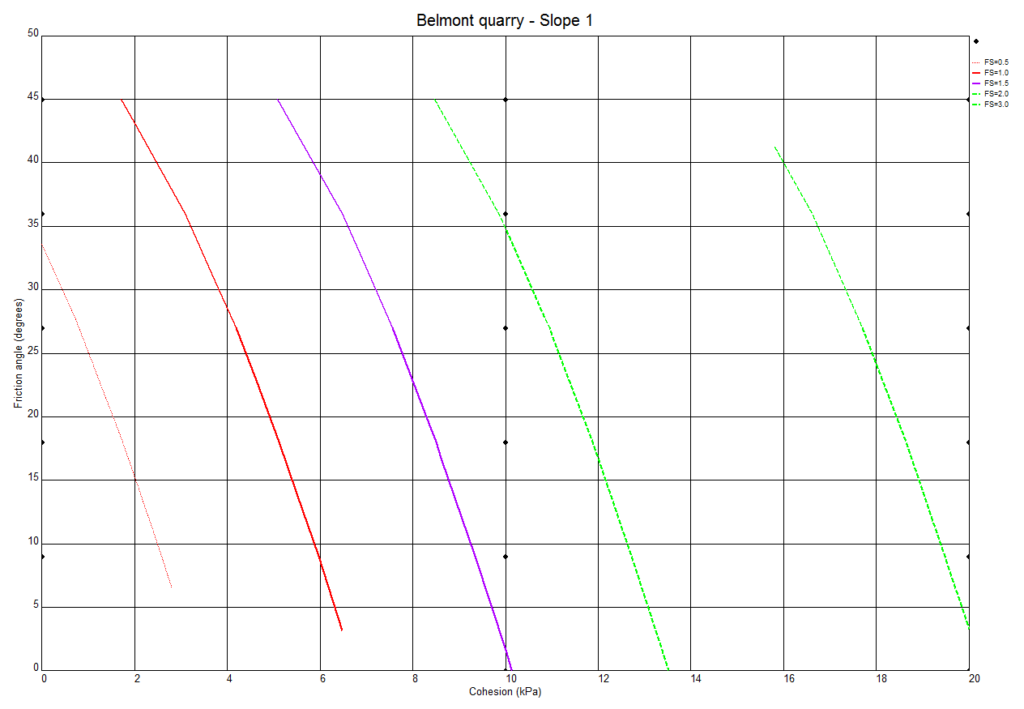
To help understand the range of strengths that would apply at a factor of safety of 1.0, we have carried out a back analysis of the slope failure using different combinations of Mohr Coulomb parameters c and phi. A cross plot showing the range of strengths corresponding to different factors of safety is shown in Figure 13.
Figure 13. Cross plot of friction angle (vertical axis) and cohesion with calculated factor of safety. Red line is FS = 1.
To help understand the range of strengths that apply in shallow slope failures such as we have described, it is recommended that other slope failures are systematically studied in this way. By aggregating the cross plots as shown in Figure 13, it will be possible to show the range of strengths that should apply to weathered greywacke at shallow depth below ground surface.
Acknowledgments
Winstone Aggregates, an operating division of Fletcher Building, provided access to their Belmont Quarry. Geoff Cooke, Quarry Manager, facilitated the UAV survey.
Jason Richards of Maptek Pty Ltd manipulated the cloud of point data in I-Site, and modelled the surfaces that were then loaded into TSLOPE.
See Maptek’s article ‘Analysis of shallow slope failure’, in Forge magazine here.

