Karaka Bay Coastal Slope Assessment Using TSLOPE
This Karaka Bay case study shows how TSLOPE can bring together historical landslide evidence, investigation data, geological interpretation, groundwater conditions, and both 3D and 2D limit equilibrium analysis in one practical workflow.
Rather than rebuilding the site manually from disconnected sources, the slope model was developed directly from real site information and used to assess a coastal escarpment with a documented history of instability.
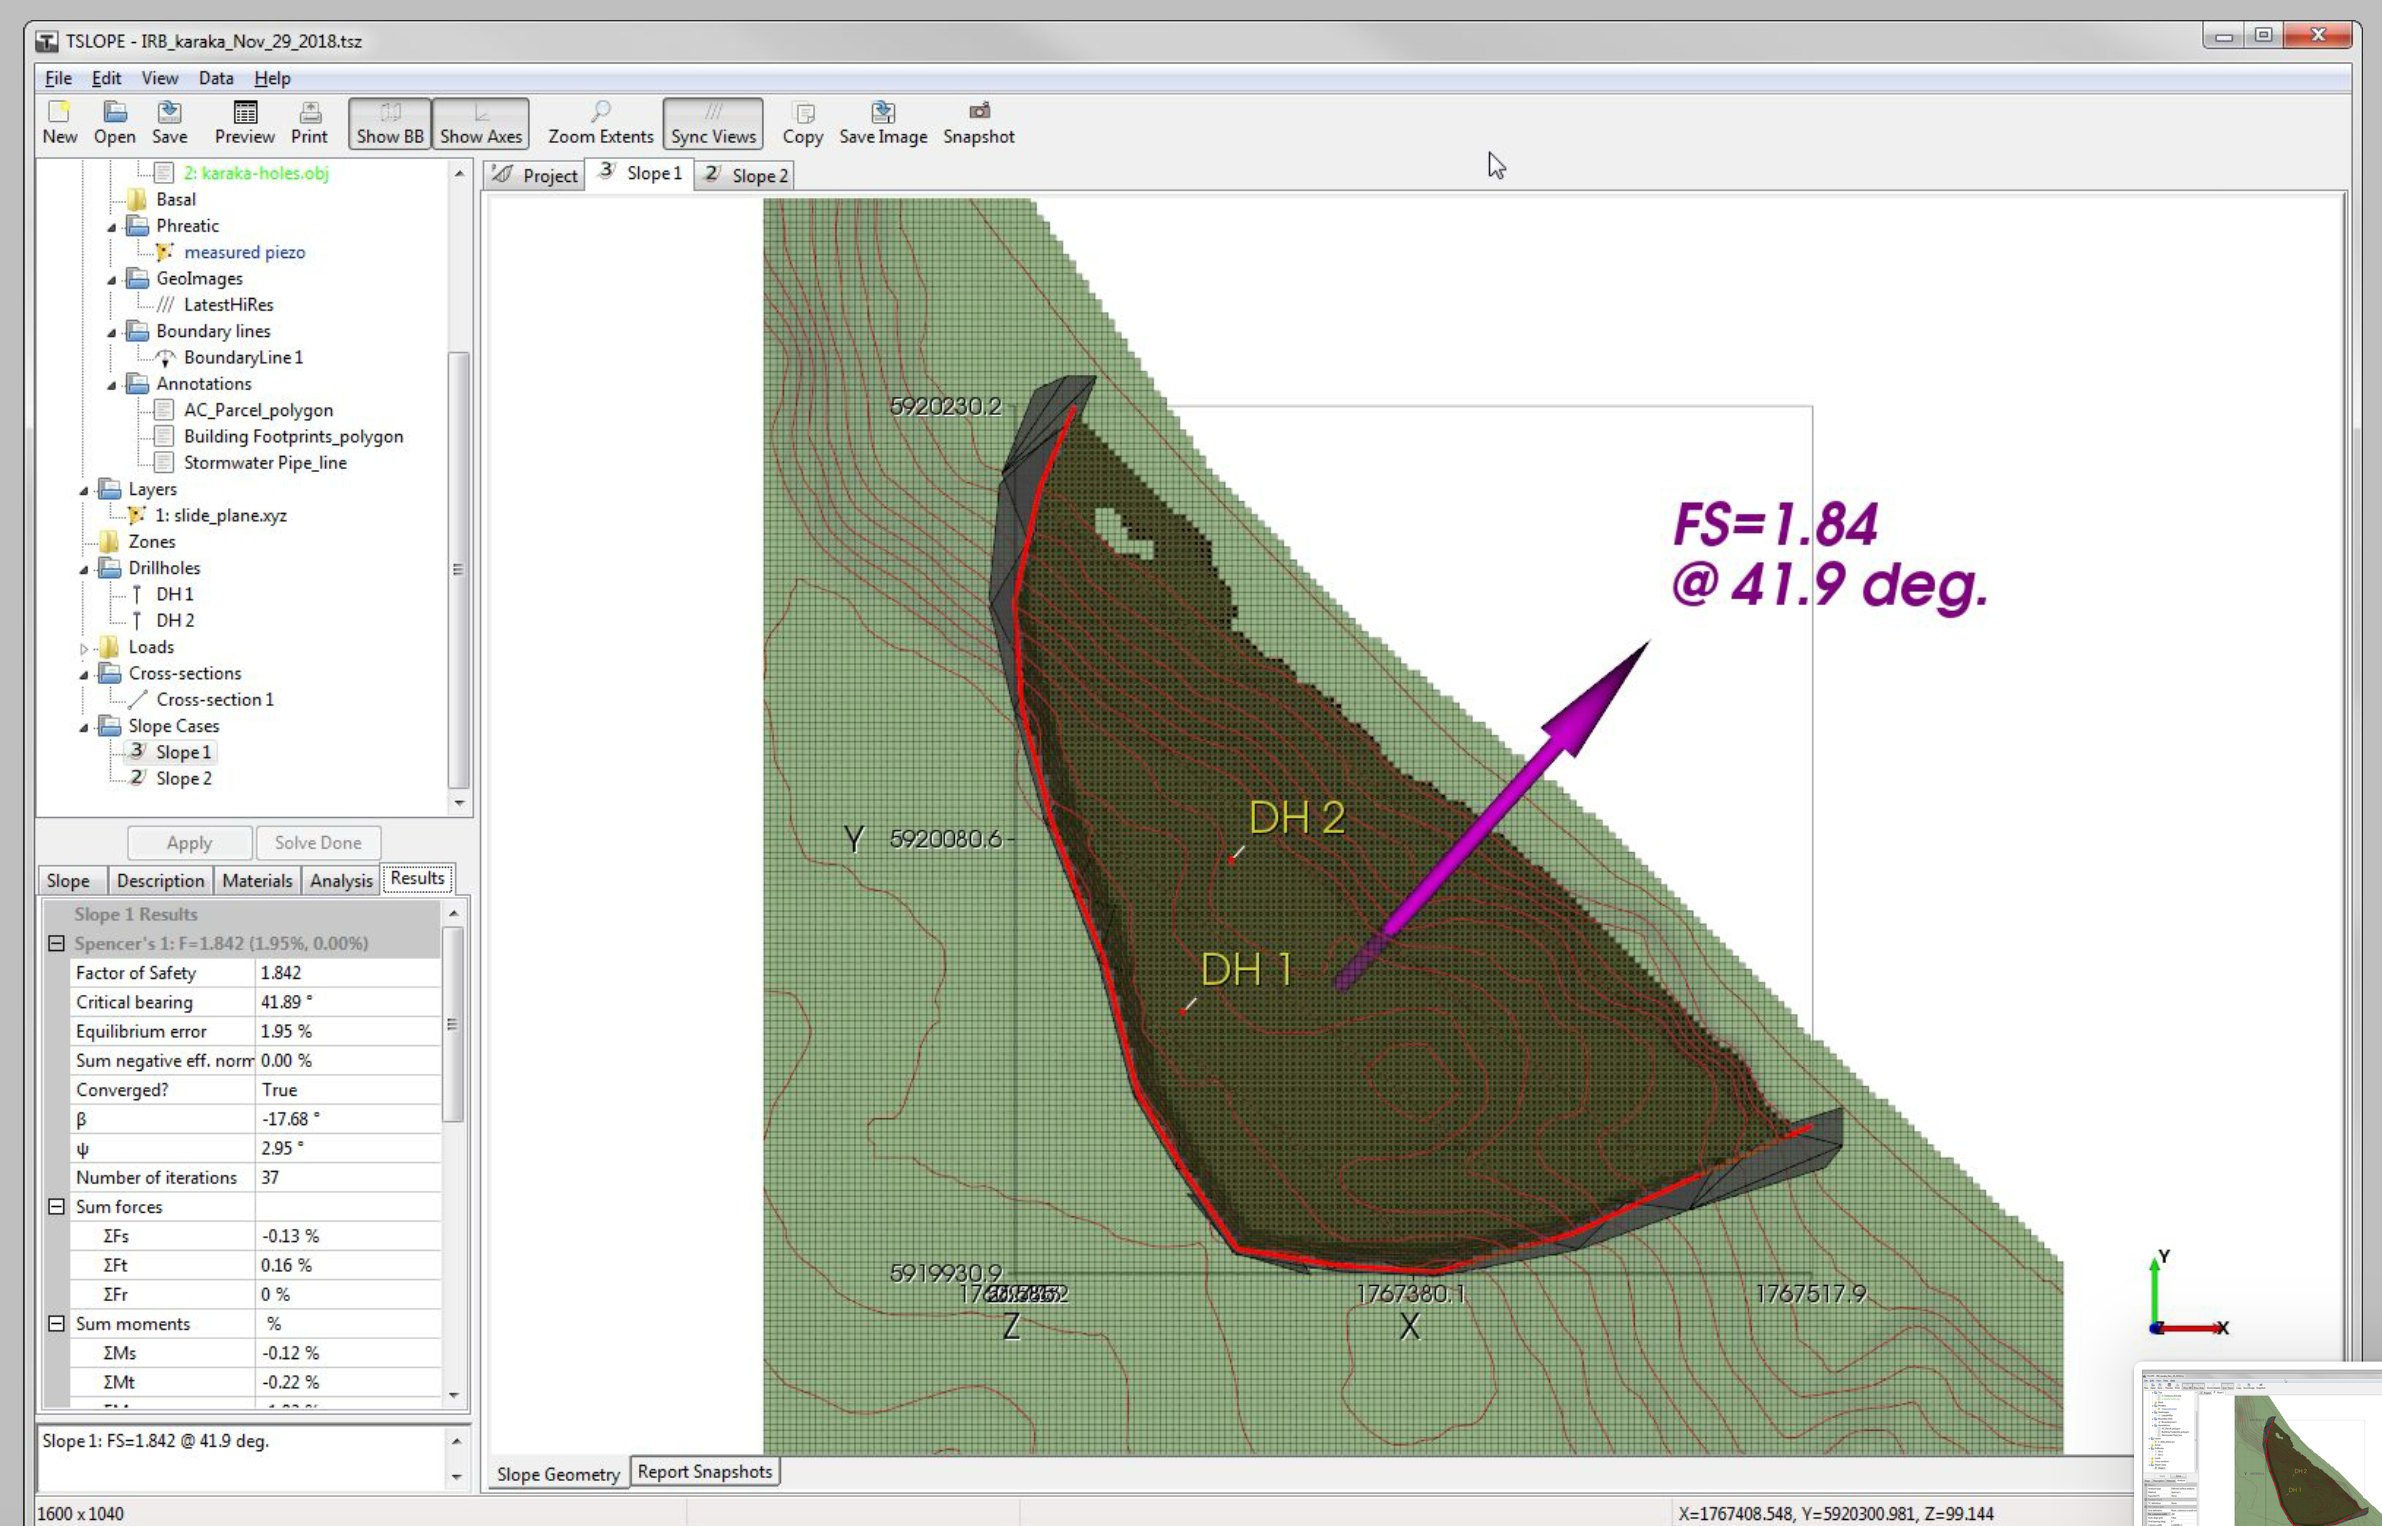
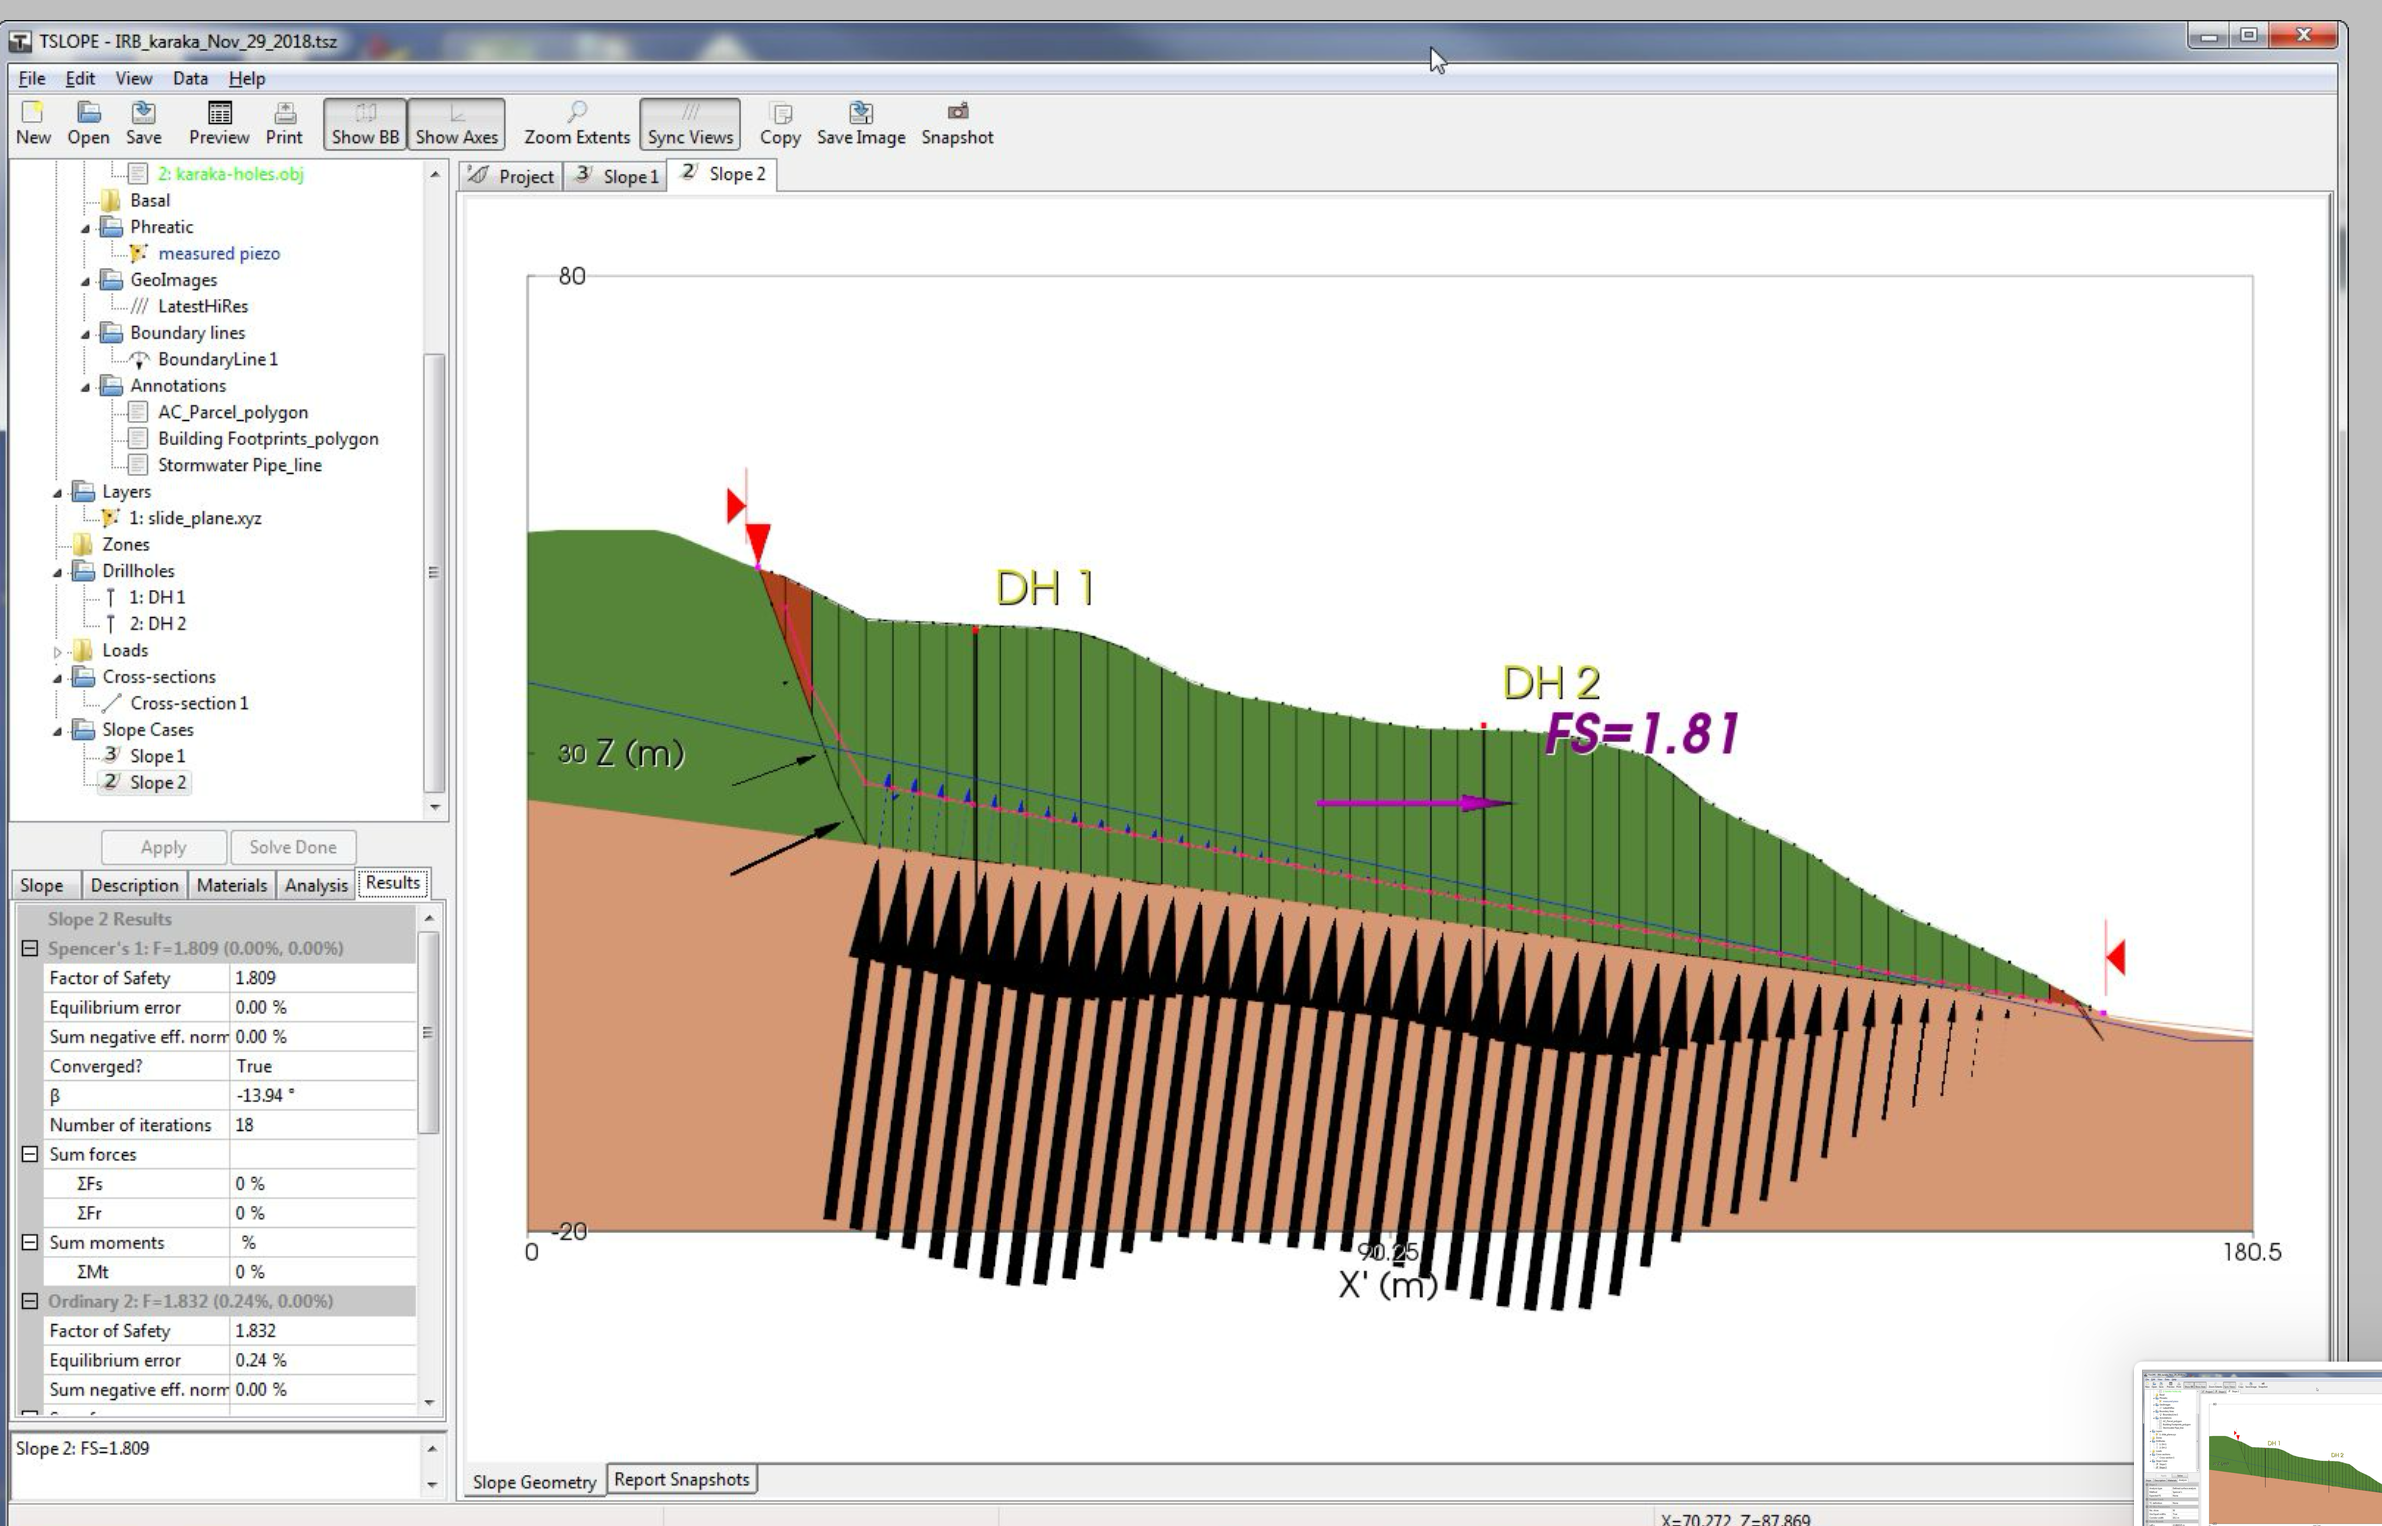
3D Spencer analysis of the full slope geometry.
2D section extracted from the 3D model for direct comparison.
Historical Instability
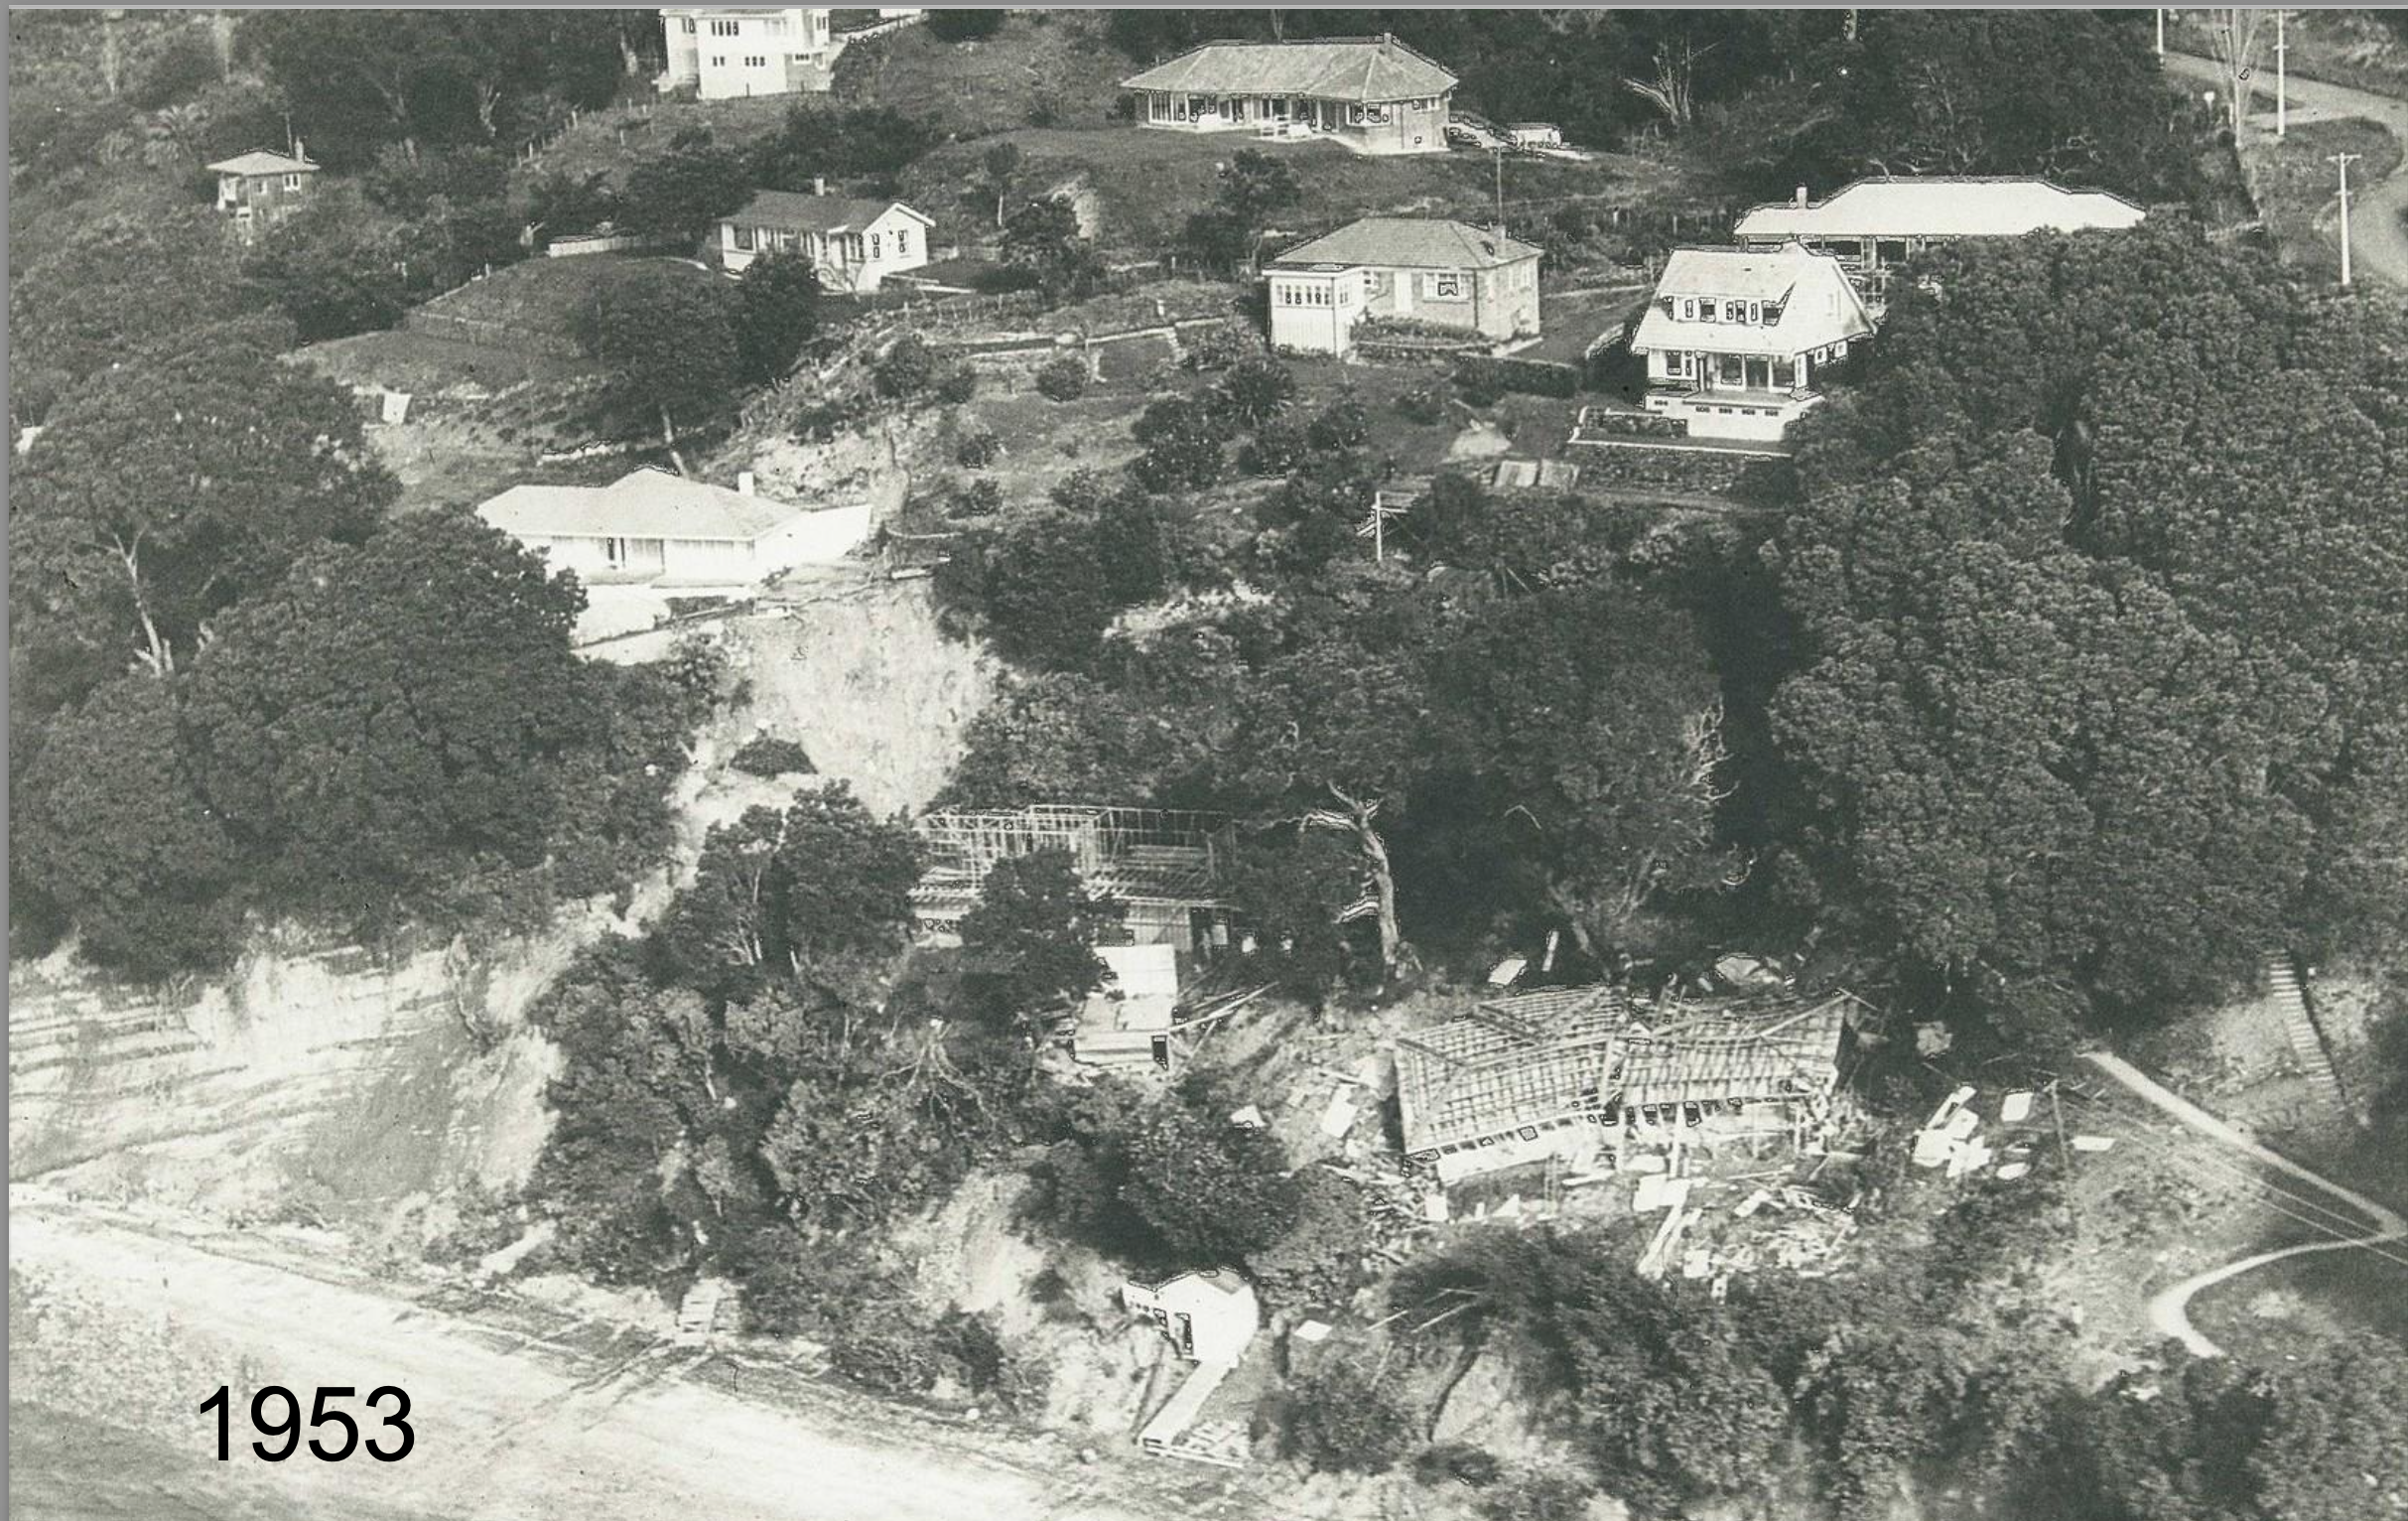
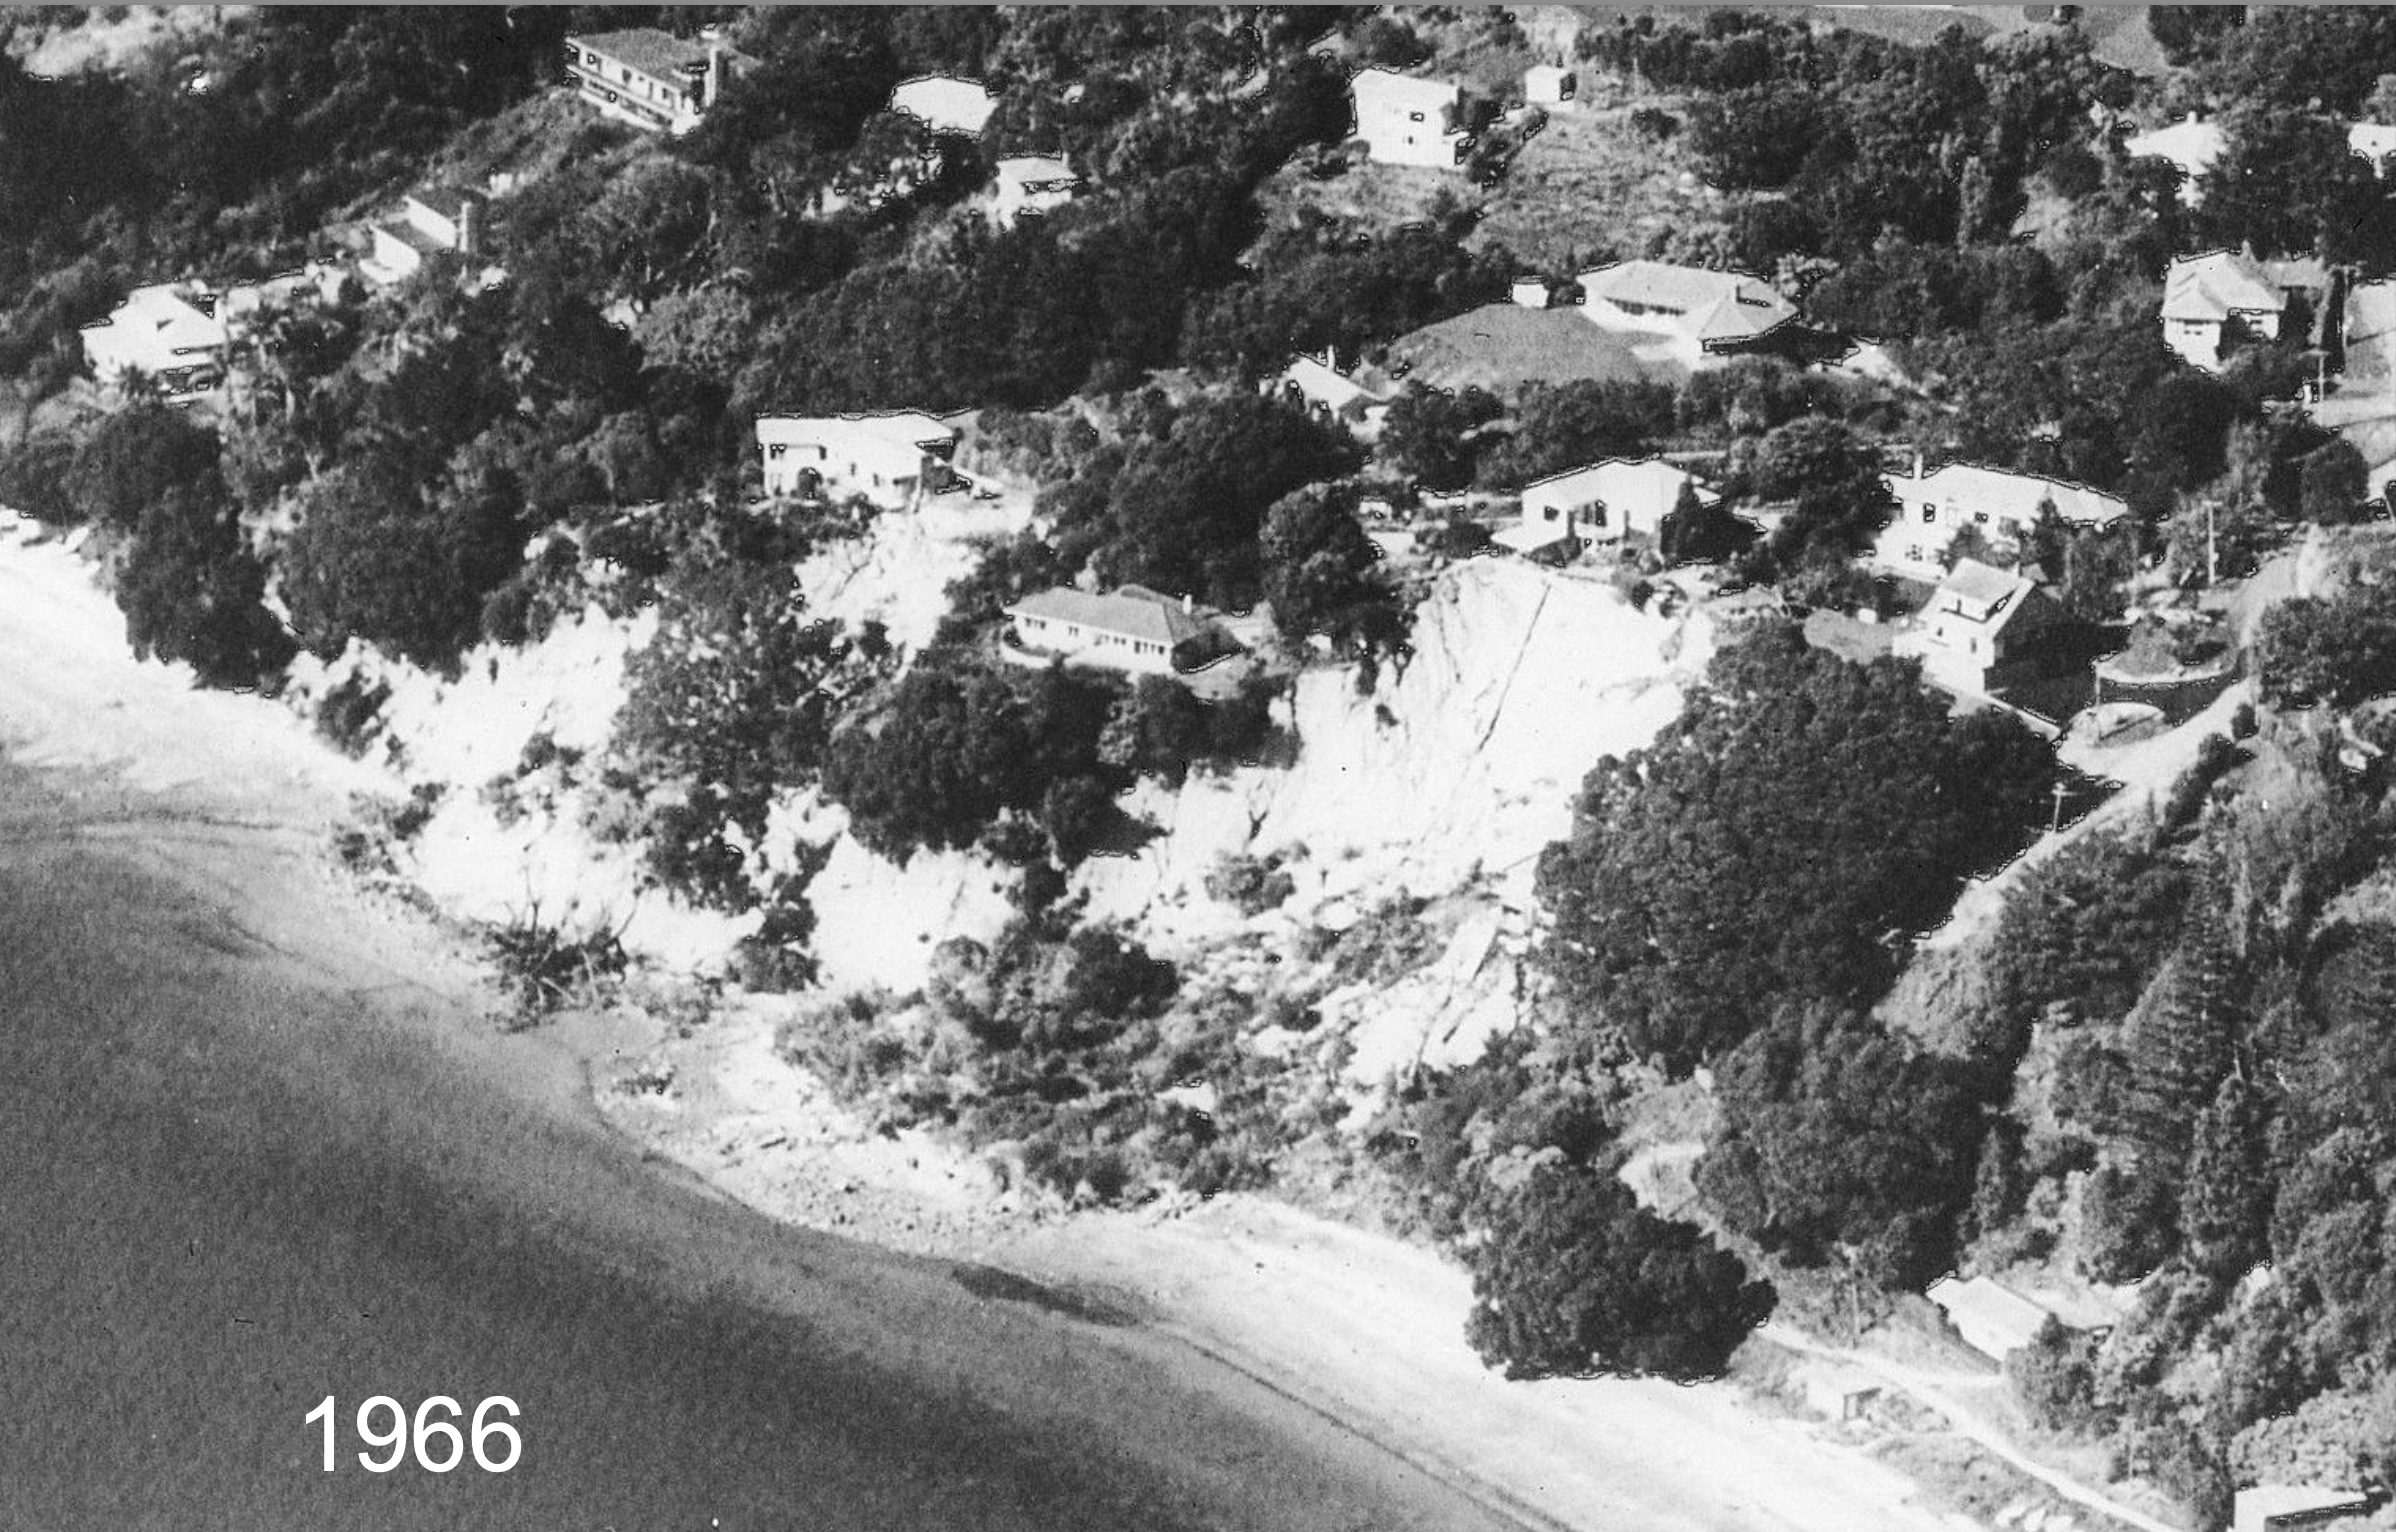
Karaka Bay was not assessed as an abstract slope. Historical photographs show that the coastal escarpment had experienced significant instability over many years, including earlier slope failures and ongoing retreat. That background mattered because it provided real-world context for the modelling and supported the need for a defensible stability assessment.
For a site like this, historic evidence helps anchor the engineering story. It shows that the assessment is tied to observed site behaviour, not just a theoretical model.
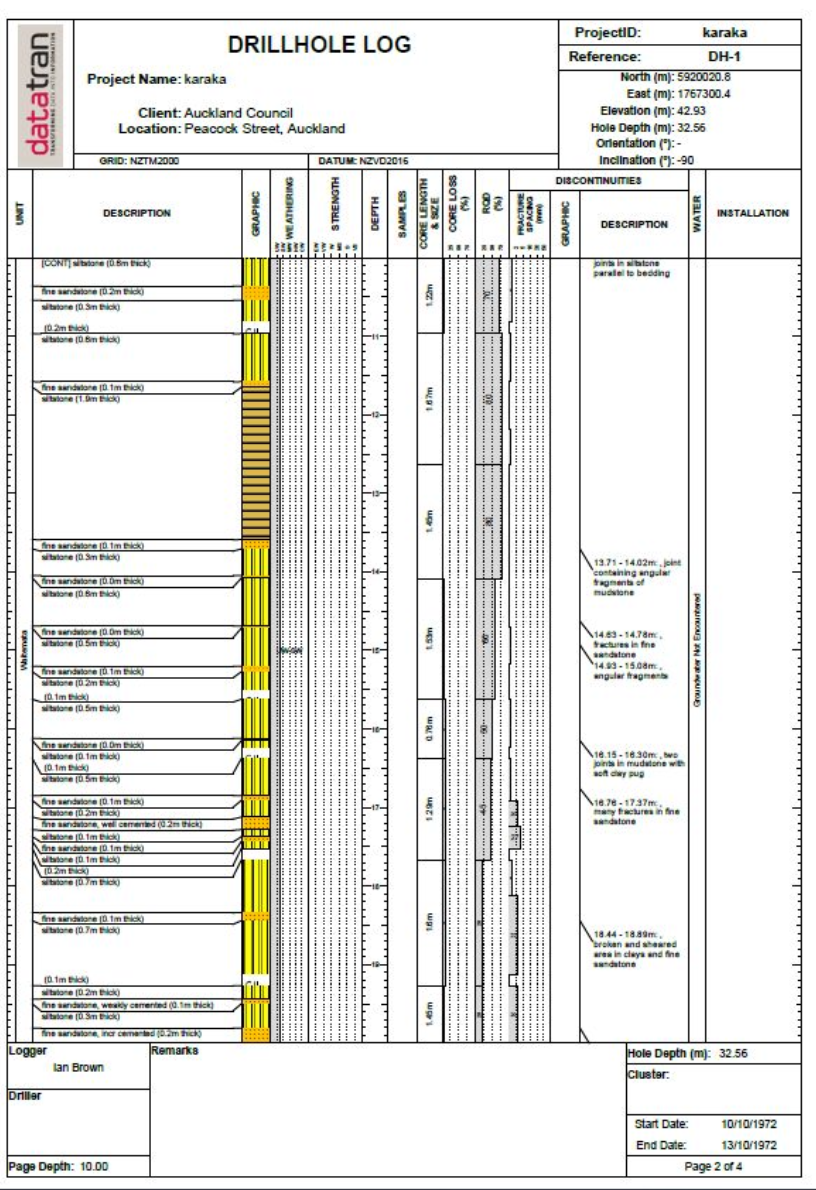
Site Data and Investigation Inputs
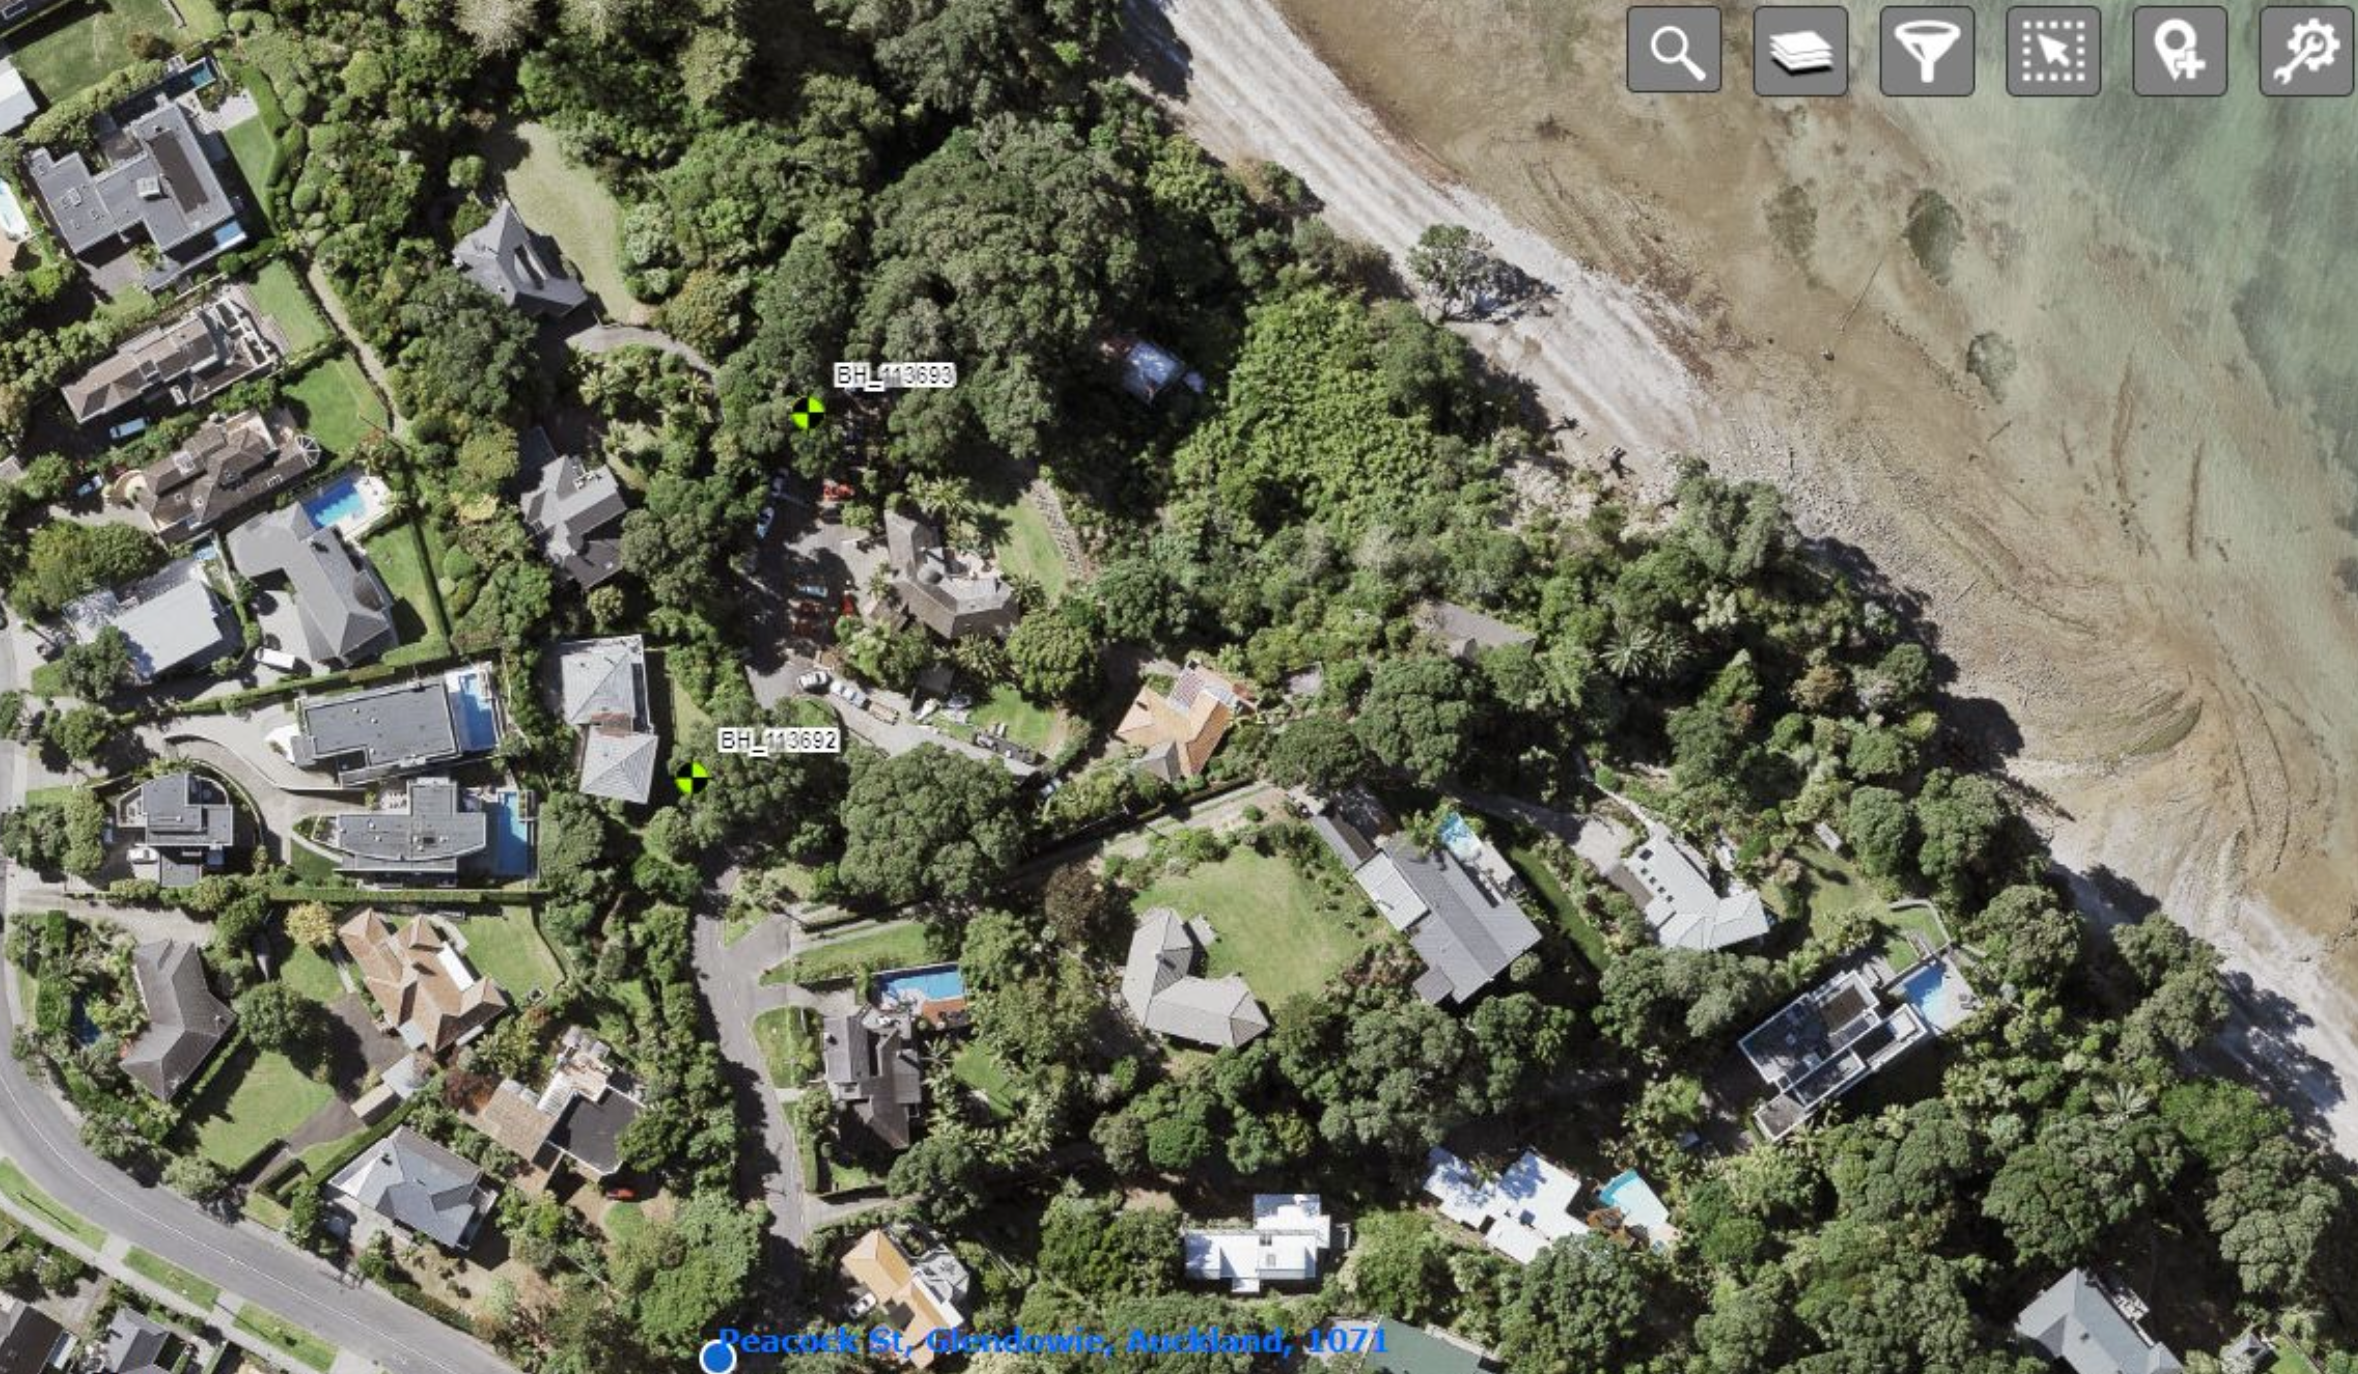
The model was informed by aerial imagery, borehole locations, drillhole logs, and historical investigation records. This helped keep the interpretation grounded in actual site information rather than relying on simplified assumptions alone.
For complex slopes, the important part is not just getting to a factor of safety. It is building a model that remains connected to the data that supports the geology, groundwater interpretation, and likely failure mechanism.
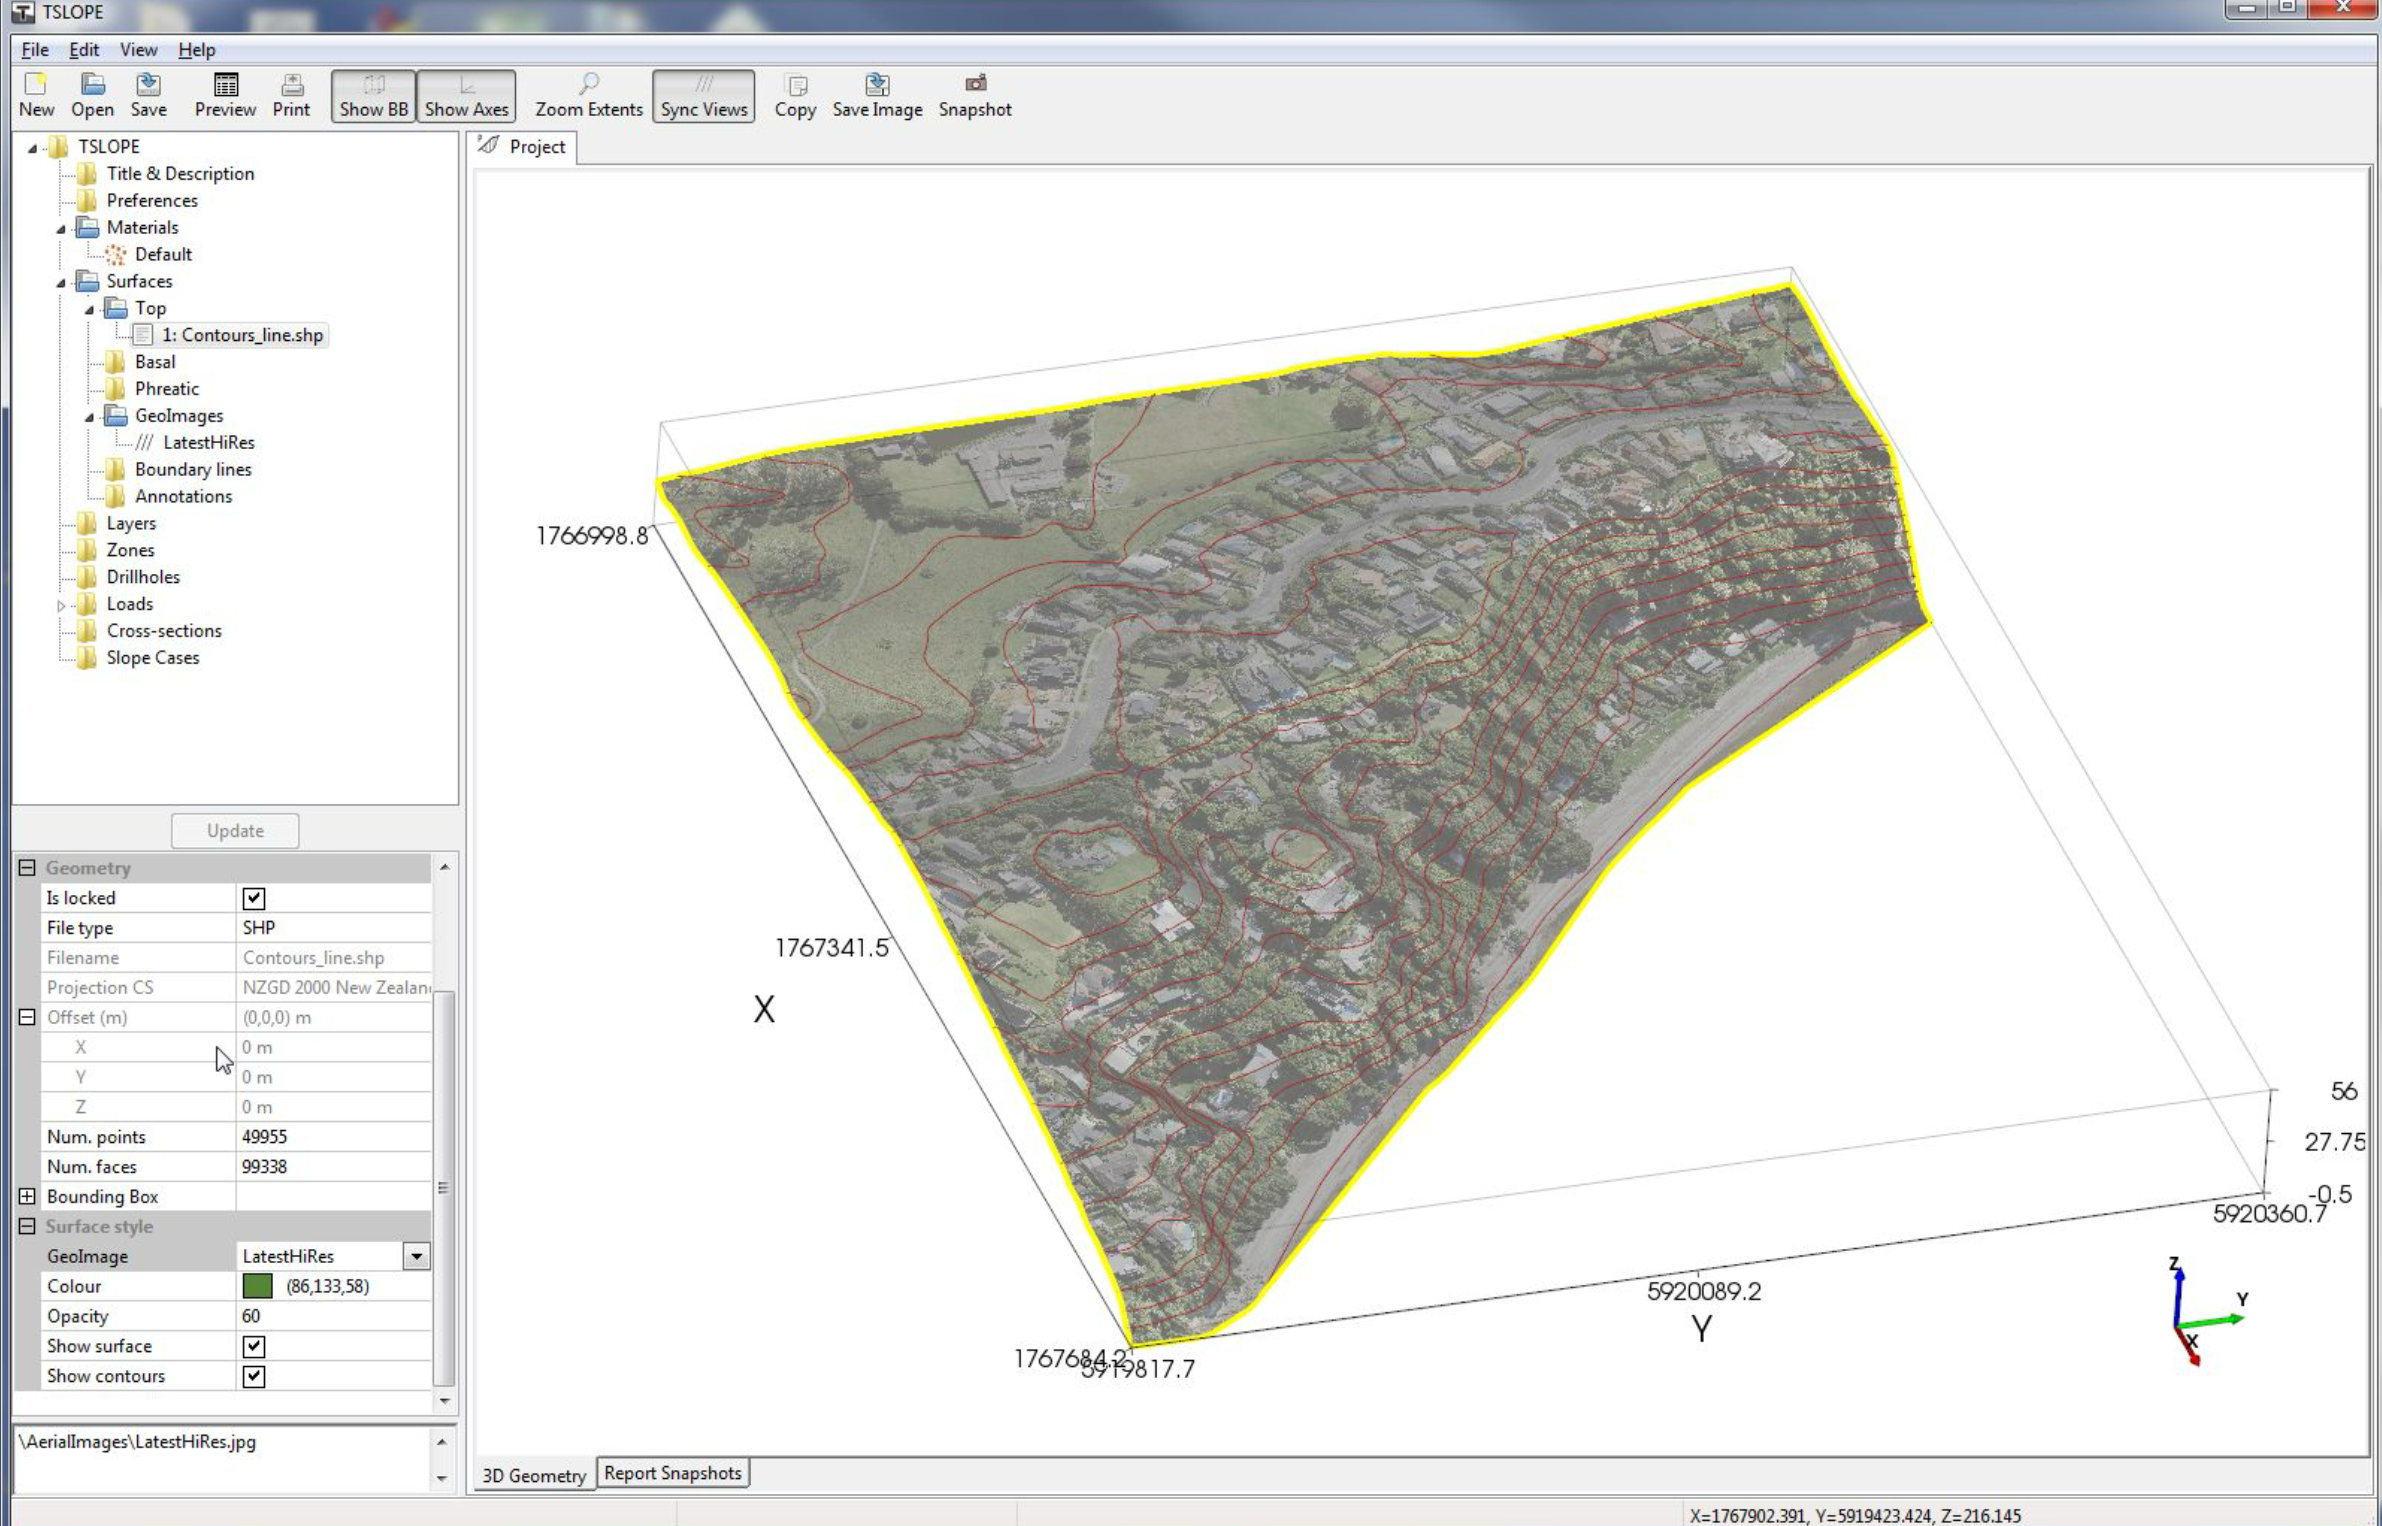
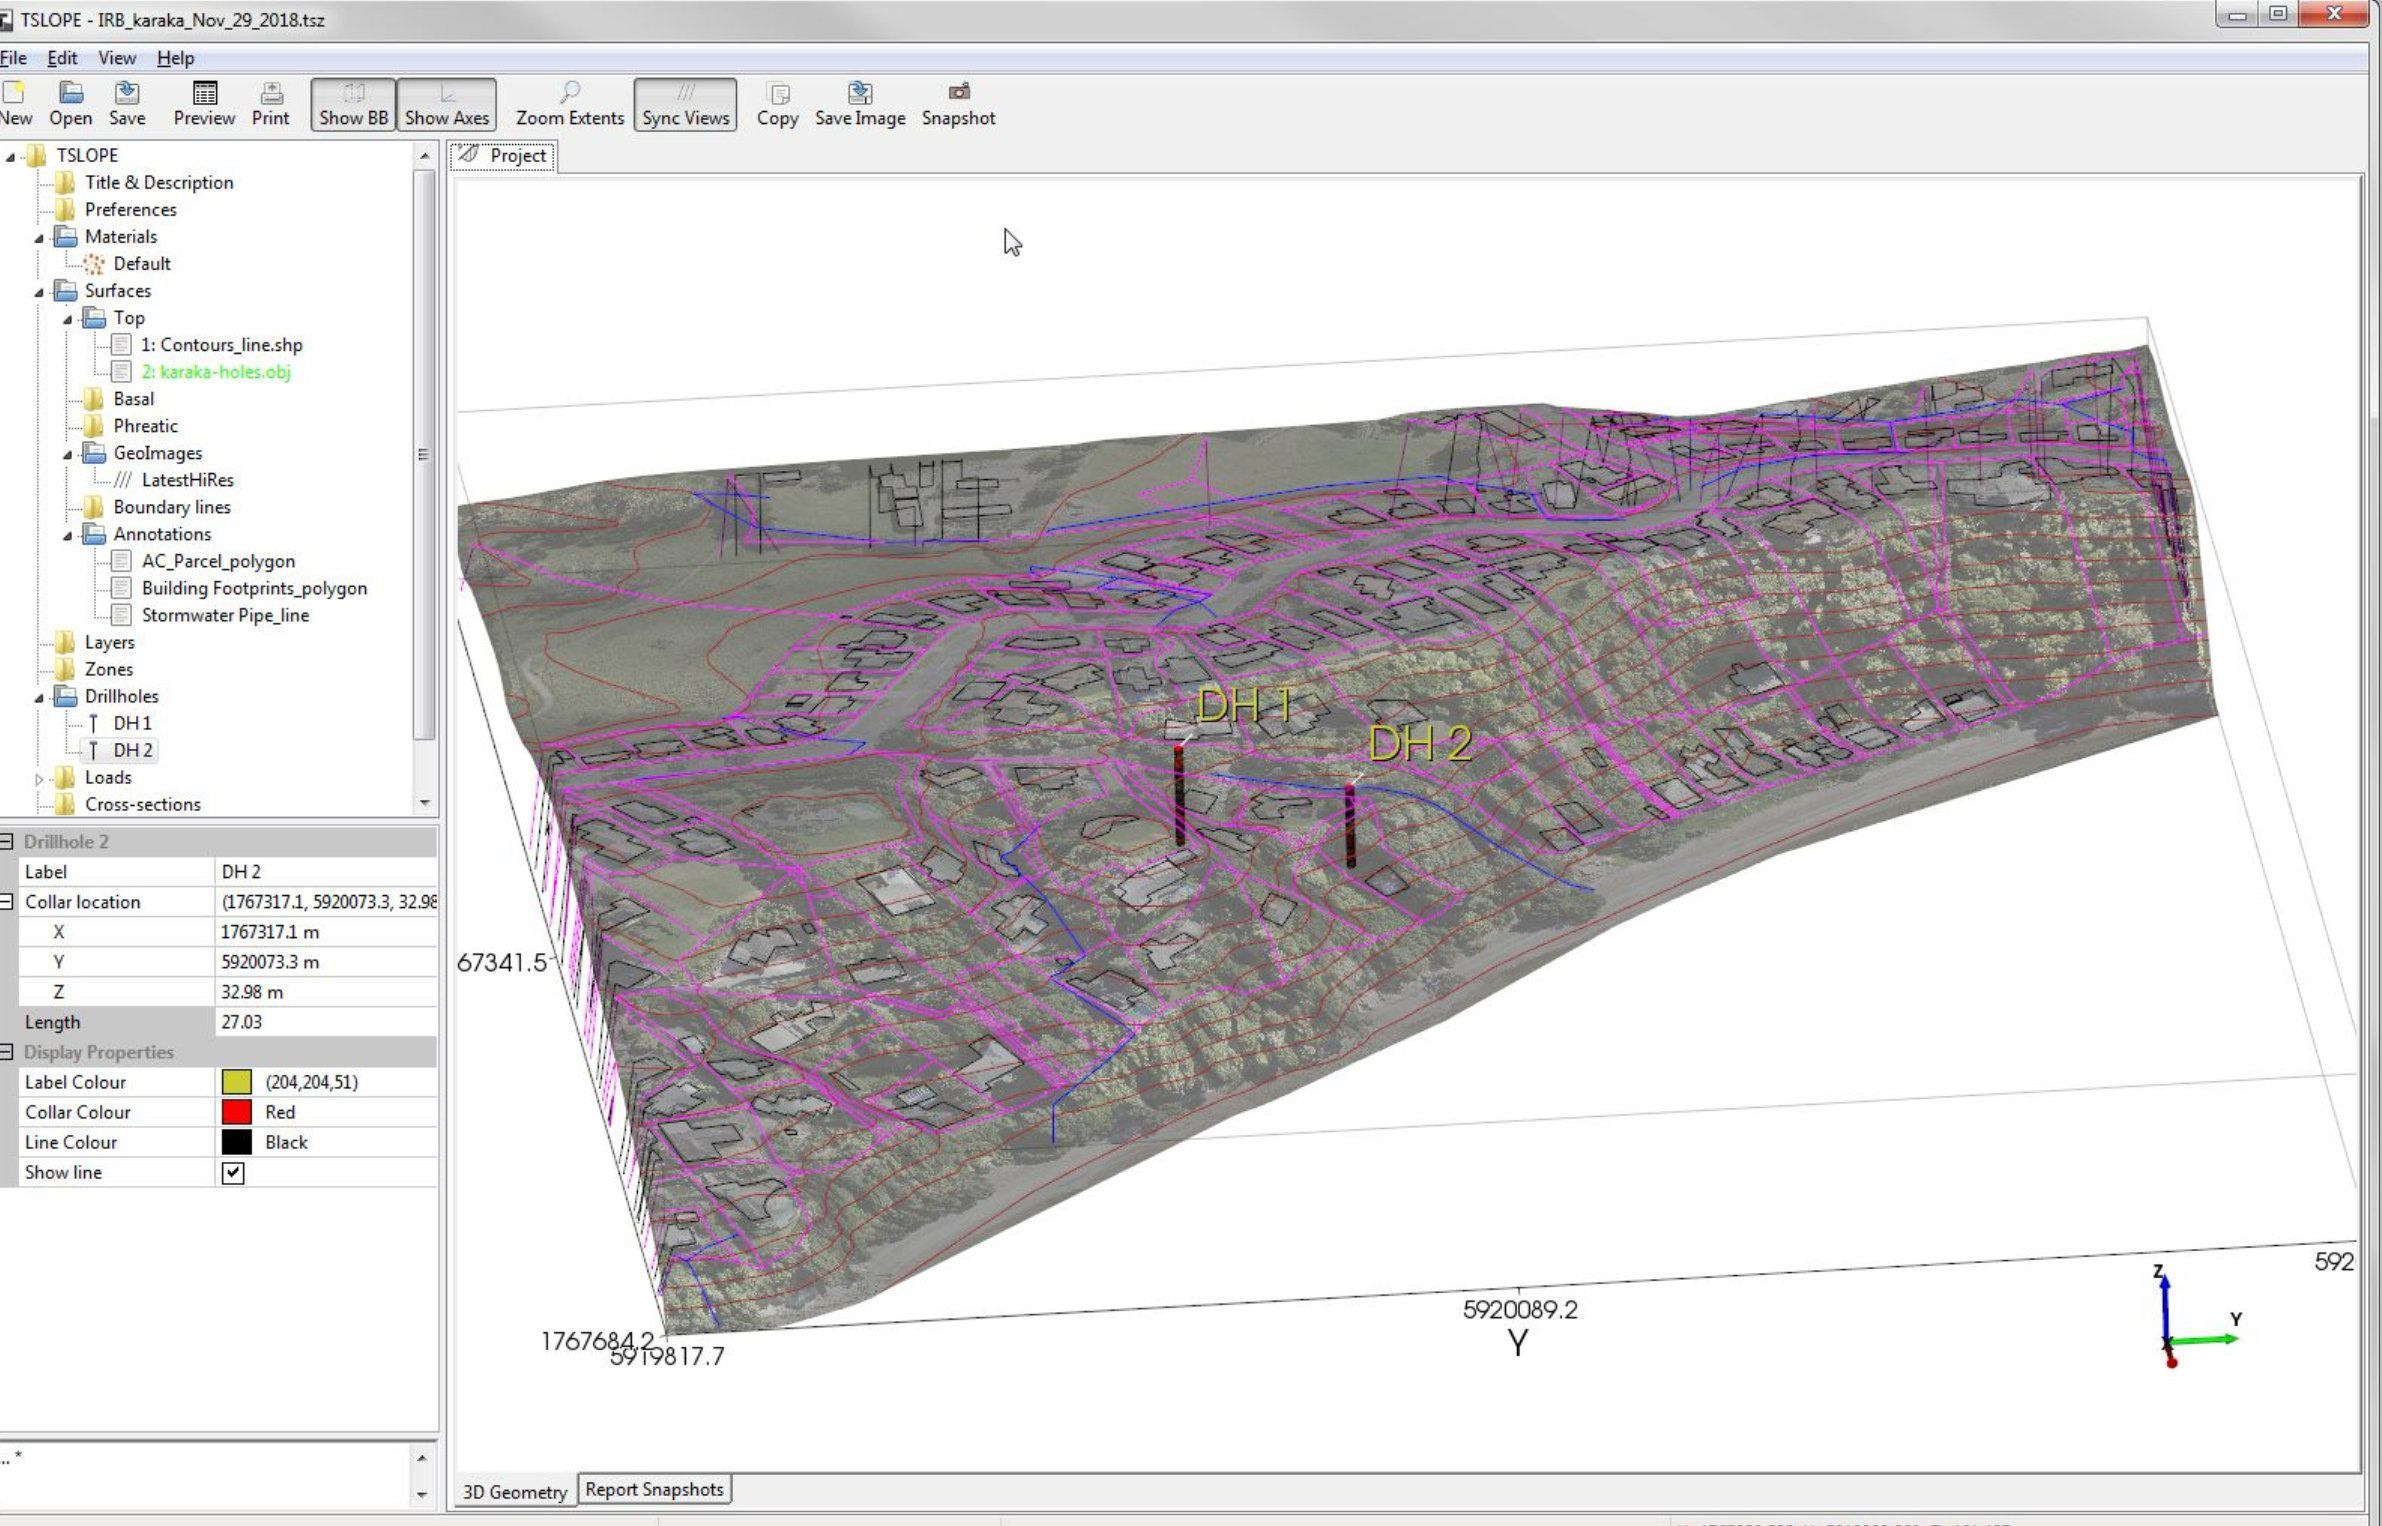
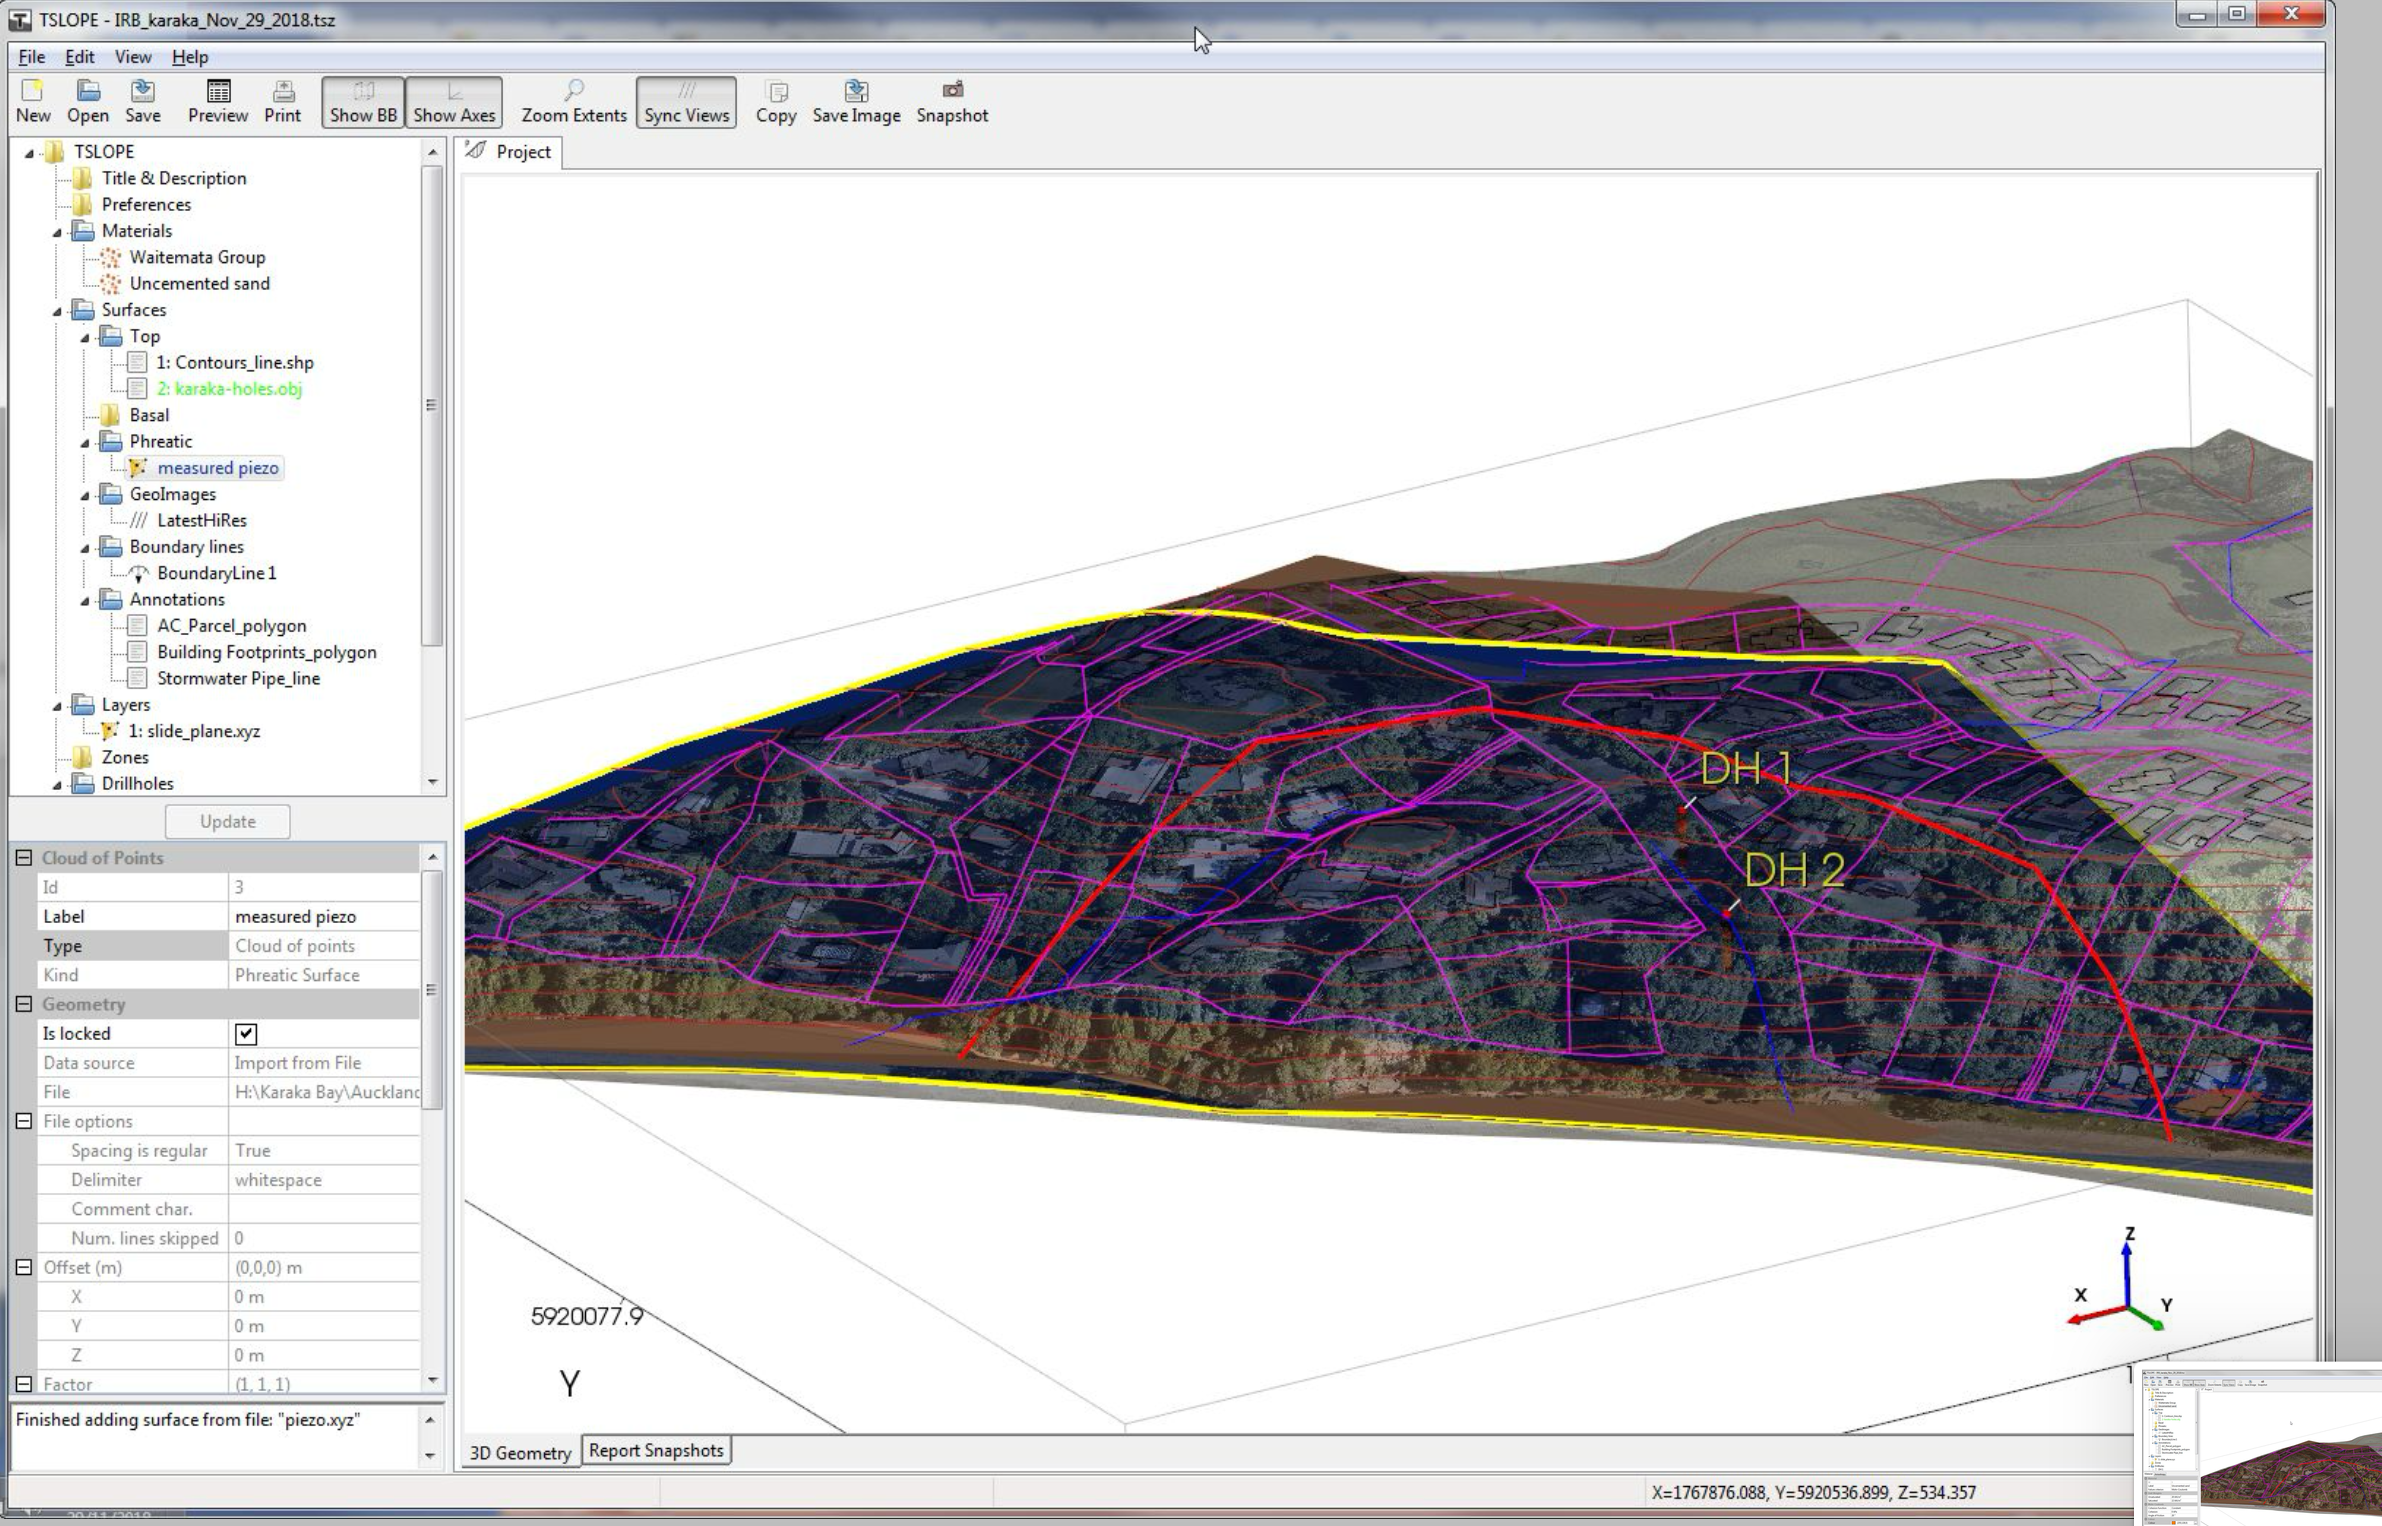
Building the Model in TSLOPE
Terrain and aerial data were imported into TSLOPE to establish the site surface. From there, the model was developed progressively by adding boreholes, material interpretation, and groundwater conditions. This workflow preserved a clear link between the source data and the analysis model.
That matters in practice. It reduces model rebuild time, improves traceability, and makes it easier to compare engineering interpretation against the final stability results.
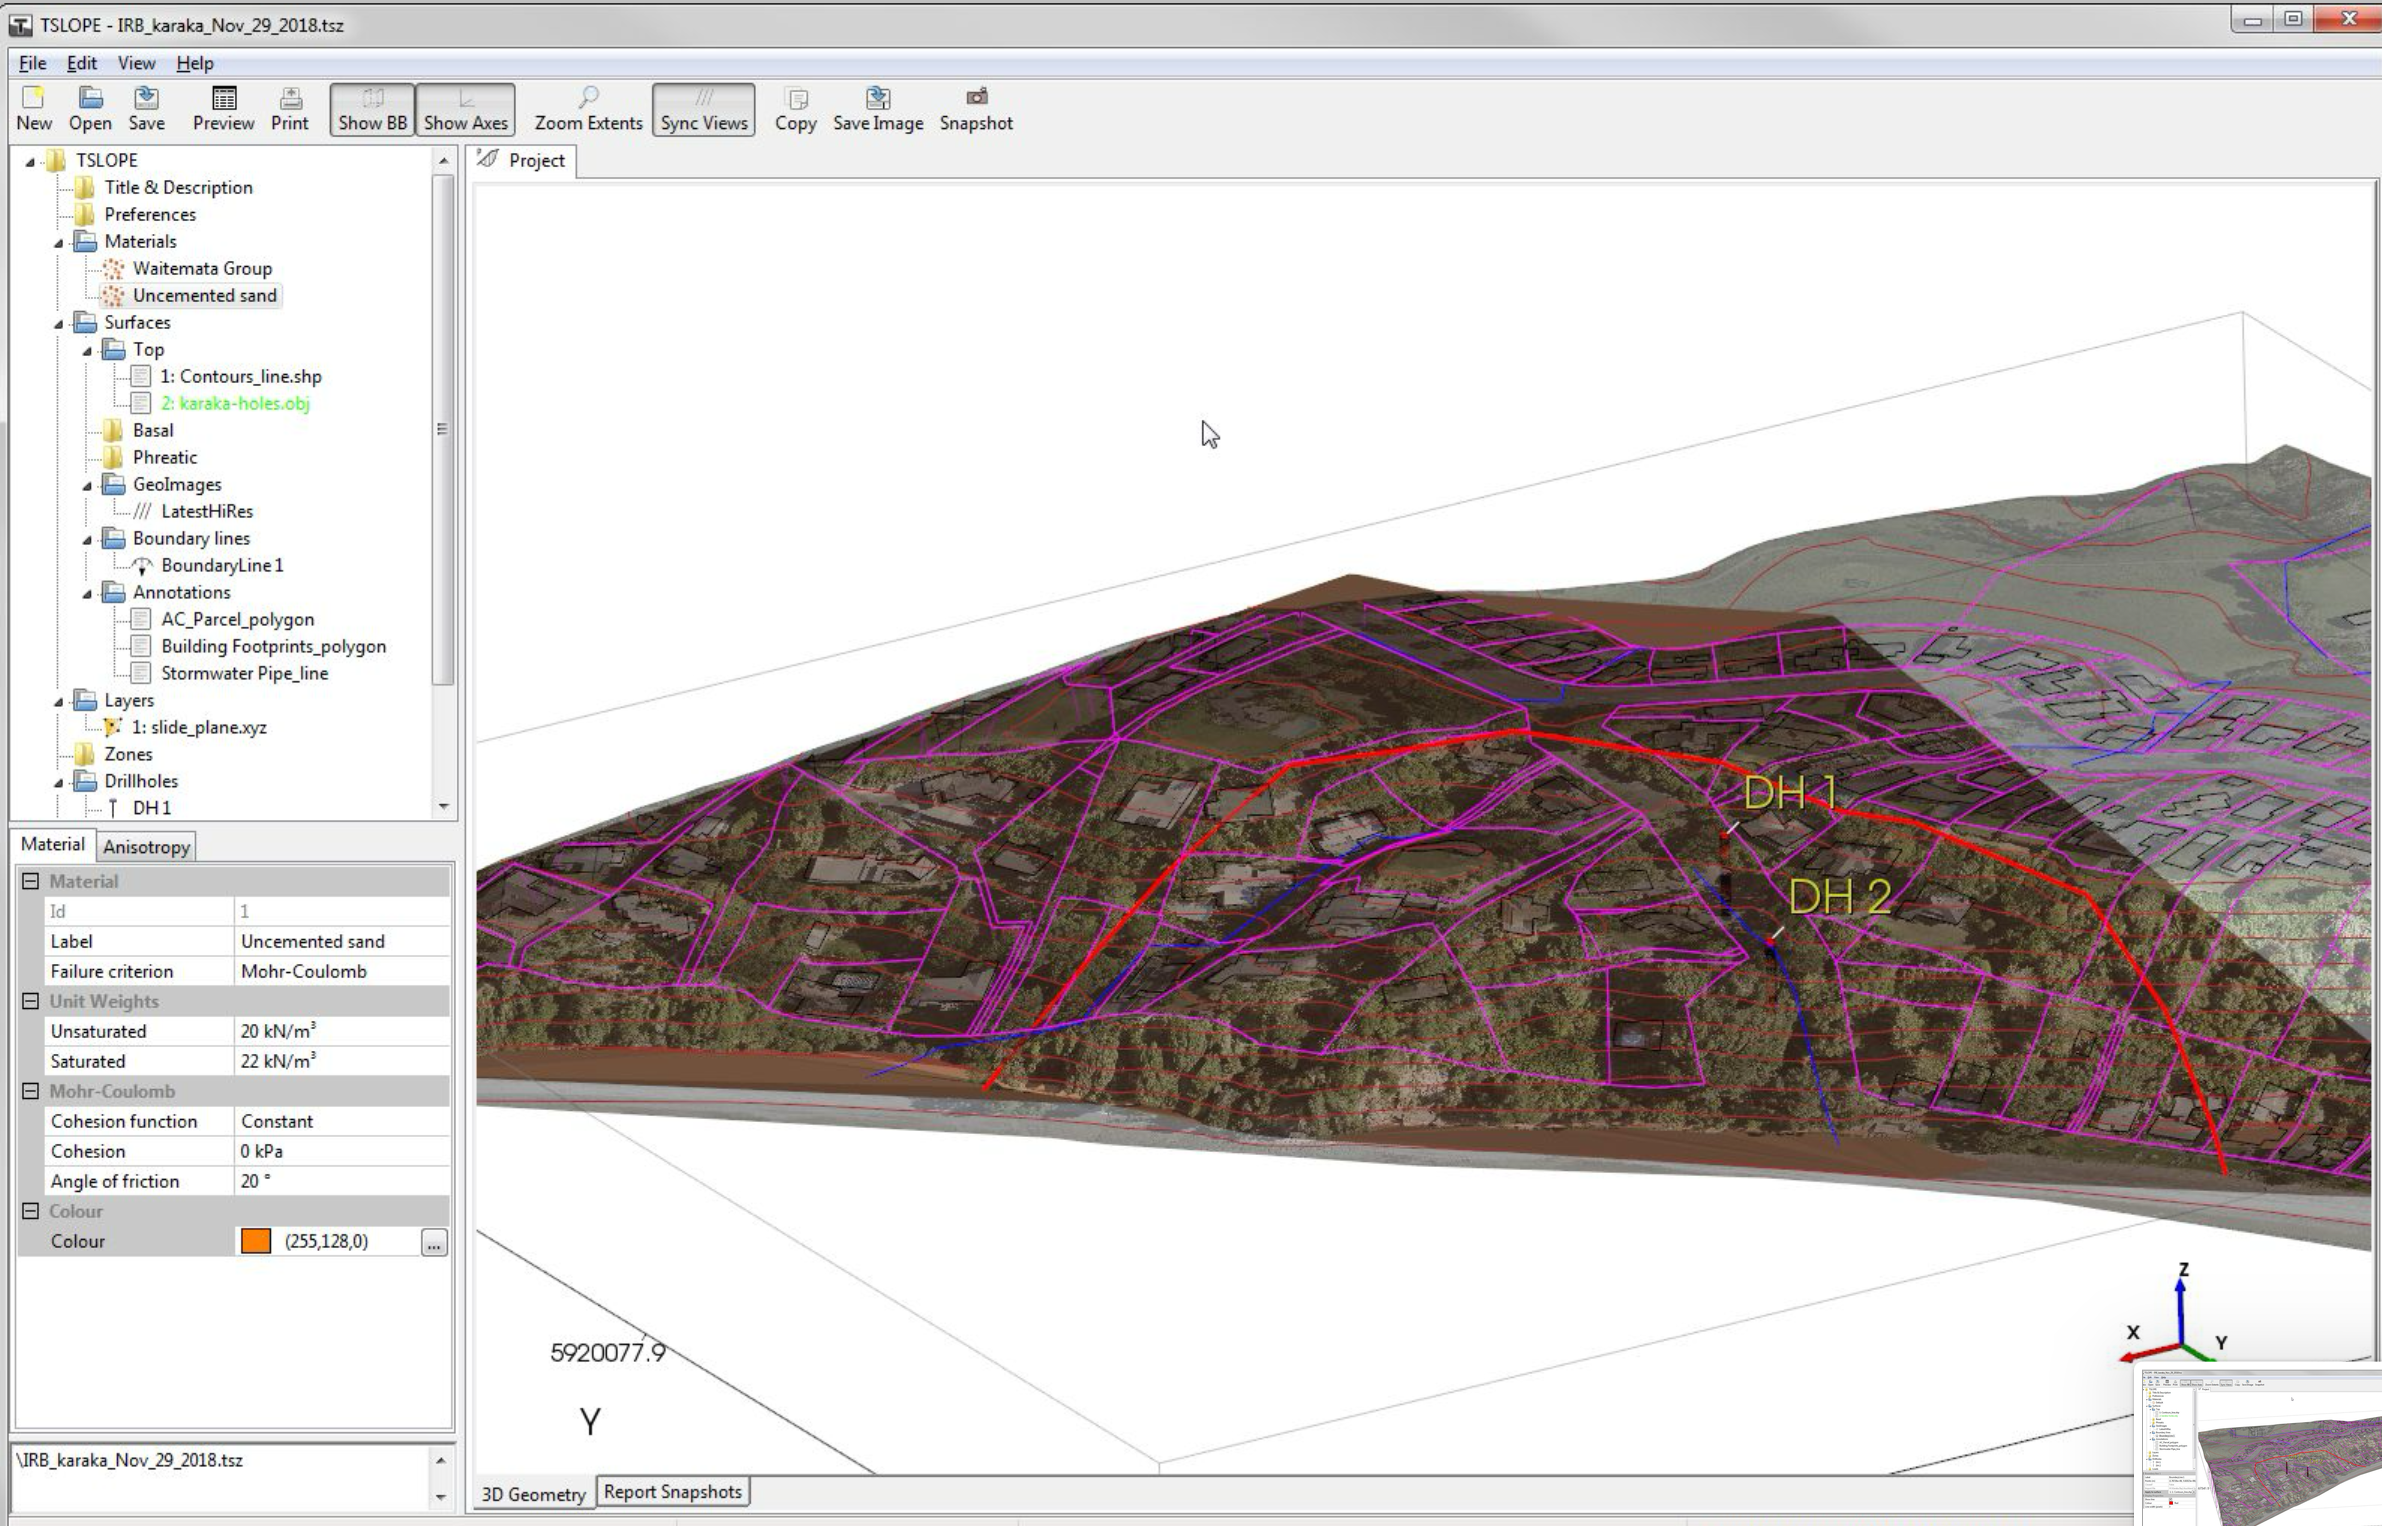
Results and Comparison
The 3D and 2D analyses produced closely aligned results. In this case, the 3D slope case returned a factor of safety of 1.84, while the corresponding 2D section returned 1.81. That close agreement supported confidence in the interpreted failure mechanism and showed that the extracted section remained consistent with the broader 3D slope behaviour.
This is where the workflow becomes practical. The 3D model captures the overall site geometry and failure mechanism, while the extracted 2D section provides a useful check without disconnecting the section from the real site model.
This Karaka Bay case study shows how TSLOPE moves from real site data to defendable 3D and 2D slope stability results in one practical workflow.
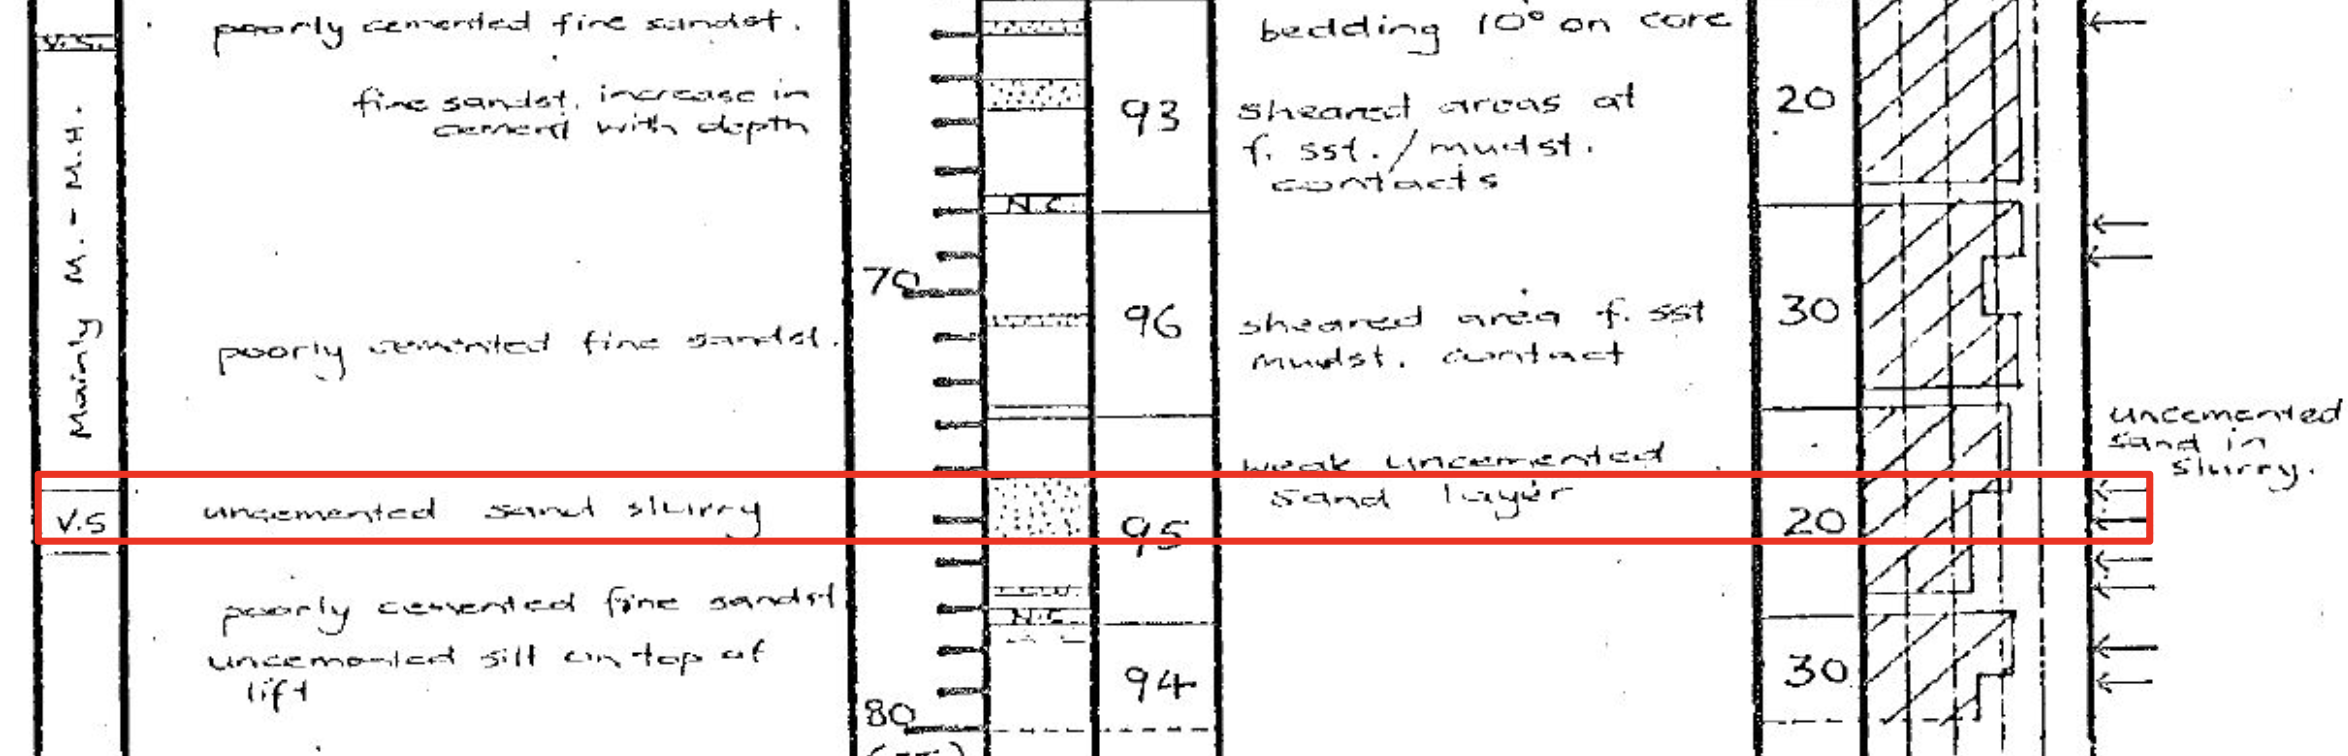
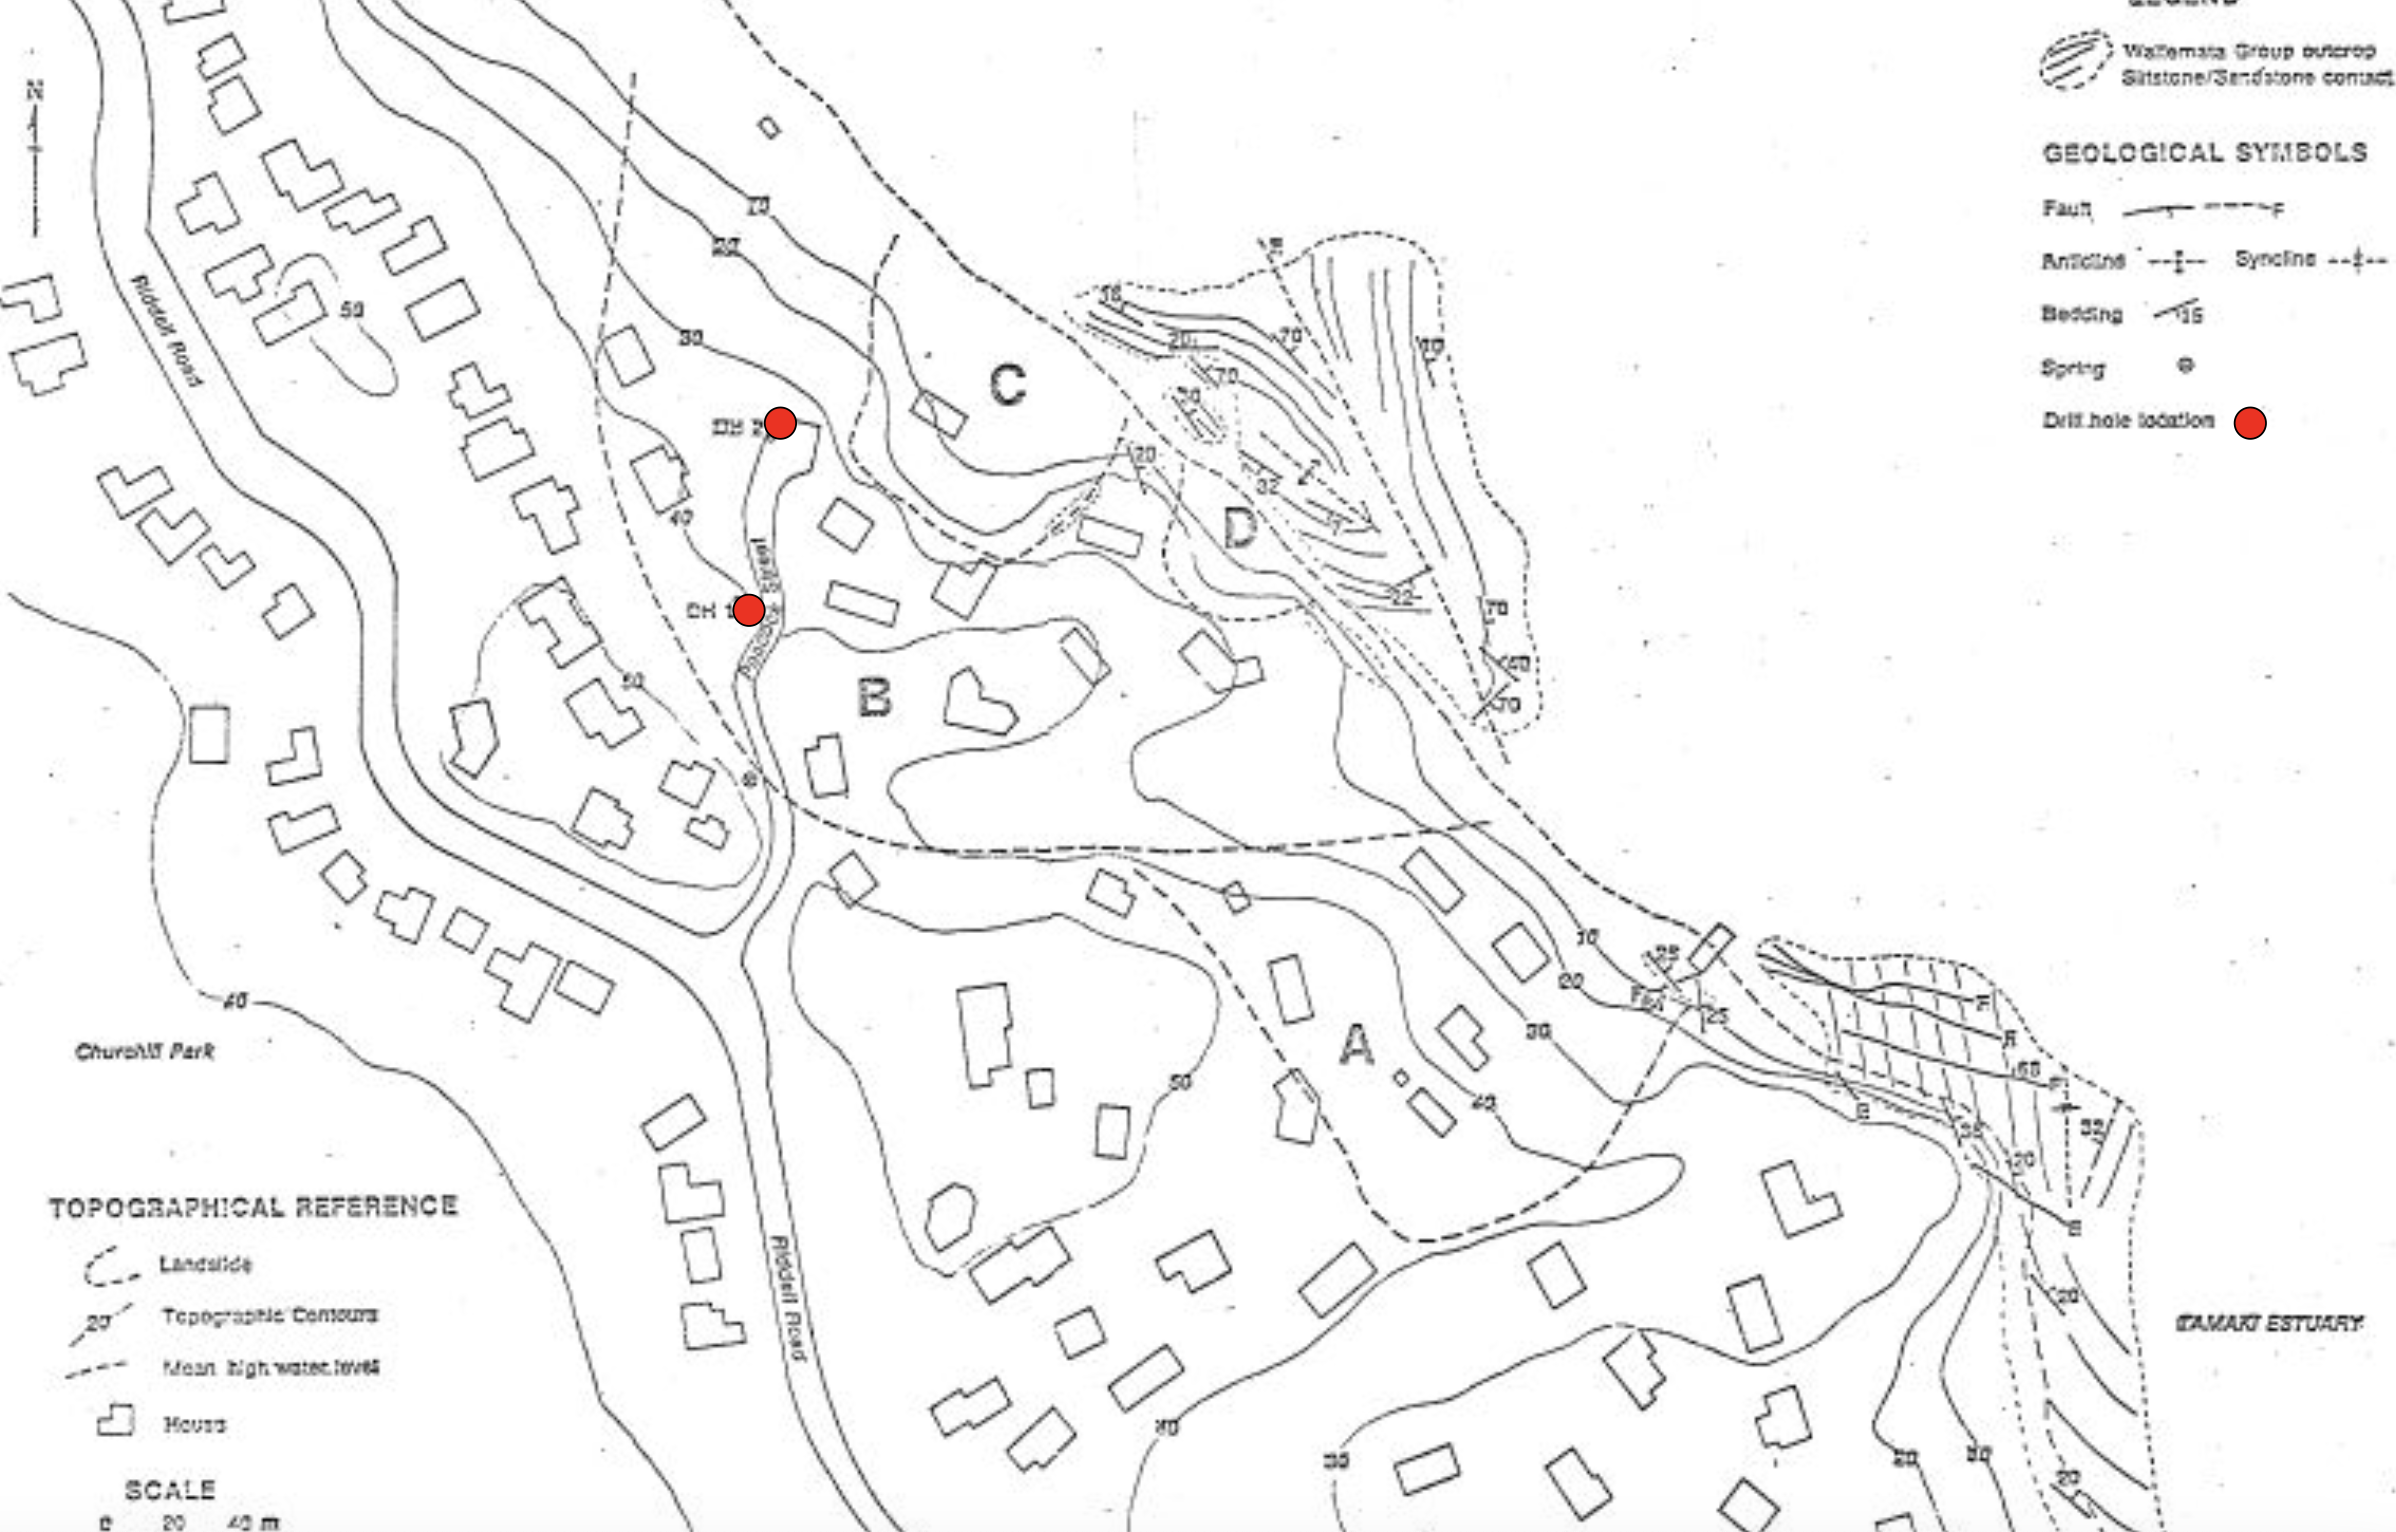
Supporting Technical Evidence
Additional investigation and historical material was reviewed as part of the assessment, including geological mapping, report records, and detailed borehole information. These records support the interpretation of the subsurface conditions and help validate the assumed failure mechanism.
Why This Matters
For real projects, the challenge is rarely just running a slope stability calculation. The harder part is building a model that stays connected to the actual site, the source data, and the engineering interpretation behind it. This case study shows how TSLOPE supports that process in a practical, defensible way.
- Build from real terrain and aerial data
- Incorporate investigation records and geological interpretation
- Represent groundwater conditions clearly
- Compare 3D and 2D slope behaviour efficiently
- Maintain a defendable workflow from source data to result