by Robert Pyke Ph.D., G.E.
March 30, 2017
General Background
While there is some published literature on the difference between 2D and 3D slope stability analyses, the truth is that, lacking suitable tools for routinely conducting 3D analyses, no-one really knows how significant ignoring 3D effects might be for a particular slope problem.
The conventional wisdom seems to be that 3D effects are generally small. This is based in part on analyses of the failure of the Kettleman Hills landfill in California. This failure occurred at a hazardous waste landfill with a slippery liner system and back slopes that widened out, so that in 3D the potential sliding mass got an extra push. That extra push only amounted to something like 8 percent of the driving forces but was still significant in back-calculations of the failure.
However, he effect of 3D geometry can be much more significant in the other direction. In 1989 the writer was approached about a problem in the design of the Canyon Nine landfill at Puente Hills in the Los Angeles area. Canyon Nine is a “bottleneck canyon” where the mouth of the canyon closes in like the abutments of a dam site. Conventional 2D slope stability analyses could not show that the planned landfill sitting on a slippery liner system would meet the normal requirement of a factor of safety of 1.5, even though common-sense argued otherwise. The writer then wrote a simple 3D slope stability program using the Method of Columns (analogous to the Method of Slices in 2D) which demonstrated the obvious, namely that if the 3D geometry was considered, the landfill would be more than adequately stable. For this problem the 2D factor of safety is 1.22 and the 3D factor of safety is 1.93, an increase of 60 percent!
That program has now evolved into the next-generation slope stability program TSLOPE, which can be used to perform both 2D and 3D analyses of the same model using either the Method of Columns or Spencer’s Method. The program also facilitates import of data from other programs. While it is particularly applicable to the more efficient design of open pit slopes where detailed 3D geometry is normally available from geologic modelling packages, it is equally applicable to other geotechnical engineering applications.
Use of the new program has turned up some surprising results. It is not just bottleneck canyons where 3D results are significantly different from 2D results. One such surprise is the difference between a 2D circular failure and a 3D spherical failure in a homogeneous cohesive slope that is described by Hungr et al. (1989). This is in effect an extension of the well-known technical note by Baligh and Azzouz (1975) on end effects. The 2D factor of safety for the problem analysed by Hungr et al. is 1.08 and the 3D factor of safety obtained by Hungr et al. and by TSLOPE is in the order of 1.40, a 30 percent increase. And, if the 3D slip surface is taken to be an ellipsoid with an aspect ratio of 0.5, the increase is more like 50 percent. On the other hand, the same problem analysed as a cohesionless slope shows similar factors of safety in 2D and 3D (Pyke, 2017).
Another surprise is the difference between a 2D failure and a more realistic 3D failure in a zoned earth dam, as described in a case history described by Brown (2017). And this can be true no matter how long the dam is. The 2D failure surface over weights the core material because the proportion of the 3D failure surface that cuts through the shell is much greater than its participation in the 2D failure surface.
A third surprise is the effect that a wall or revetment can have on the stability of a long slope. This falls in the category of things that are obvious once they are pointed out to you, but were not so obvious previously. The point is that a wall or revetment often does not participate in a 2D slope stability analysis because the critical slip surface dives under the wall or revetment. However, a 3D failure surface must cut through the wall or revetment. This effect will be greatest when the slide is narrow in the direction along the wall, that is, it has an aspect ratio of less than one. As the aspect ratio of the 3D slide surface increases and it encompasses more of the length of the slope, the effect of the 3D failure will decrease and the computed factor of safety will approach but never reach the 2D value. Many natural landslides have an aspect ratio of less than one and 3D effects can be significant.
The overall point is that you will never know unless you check. The following real-world example shows the difference that 3D analyses make in both static slope stability analyses and in simplified seismic deformation analyses that require computation of the yield acceleration using a slope stability program.
Real World Example
This example involves Treasure Island, a man-made island in San Francisco Bay, which was originally intended to serve as an airport, but, after the completion of the 1939 World’s Fair, the island was taken over by the US Navy. It is presently being redeveloped for civilian use. The sand fill that was place to form the island will be densified to mitigate possible liquefaction, and prefabricated vertical drains and surcharging will be used to limit future settlement of the underlying young Bay Mud. The final grades will be raised up to 5 feet to allow gravity flow of stormwater for the foreseeable future, even accounting for sea level rise. The cross section below and the soil properties are taken from publicly-released bid documents.
In part because an initial layer of sand fill was placed prior to the construction of the perimeter rock dikes where the original ground surface elevation was less than -6, as can be seen in Figure 1 which shows Section D-D’, there remains some concern about the stability of the perimeter of the island, particularly in earthquakes since the site sits in between the active San Andreas and Hayward faults. Likely this sand layer has been compacted to some extent since its original placement by the Loma Pieta earthquake and repeated wave loadings, and at least the sands under the original rock dikes can be further densified to some extent if dynamic compaction is used to compact the sand layer up to the edge of the revetment and specialist techniques are used to reach in under these dikes. It may not be possible to further compact all of the sand layer in Section D-D’ that continues under the rip-rap, however, my subsequent calculations suggest that this is not critical to the stability of the revetment since the critical failure surface in a conventional stability analysis lies within the young Bay Mud.
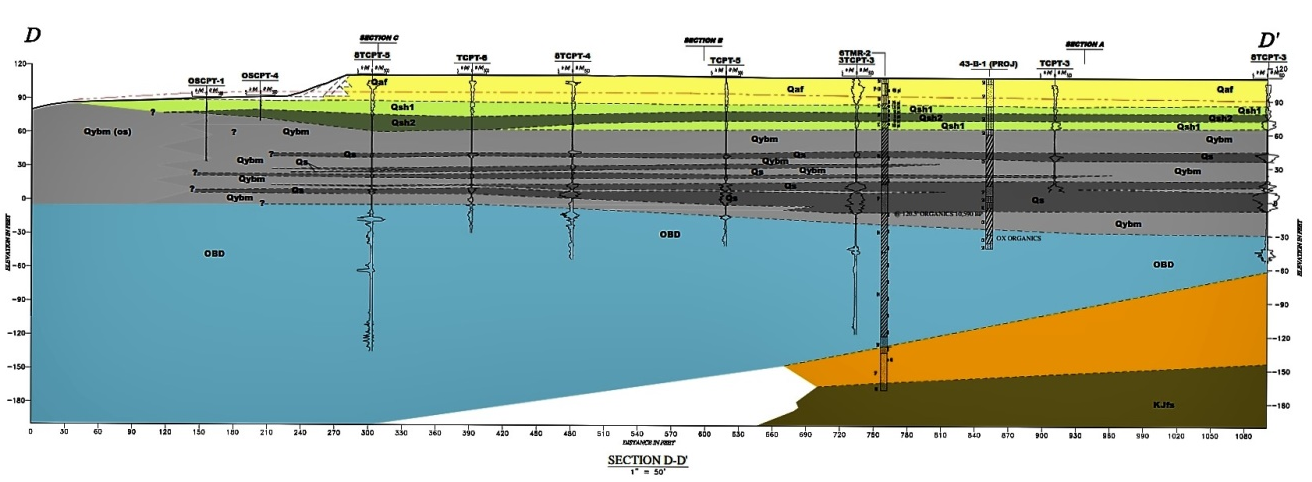
Figure 1 – Section D-D’
The shoal materials which underlie the sand fill are clayey sands that generally contain from 15 to 30 percent fines. These materials are not liquefiable in any conventional sense and they were very resistant to densification by vibratory loading in trials that were performed at the site. The properties of the shoal materials are discussed in greater detail subsequently, but on the face of it, if the hydraulically placed sand fill is densified, the shoal materials do not show a loss of strength under vibratory loadings, the young Bay Mud is consolidated not only under the weight of the existing fill but under additional surcharge loads, and the rock revetment is composed of free-draining, competent rock, there is no obvious concern about shoreline stability at this site, even given its proximity to the San Andreas and Hayward faults.
Nonetheless, in the bid documents there are brief descriptions of work done by the project’s geotechnical consultant using simplified methods of analysis, which may be commonly used but are now increasingly being recognized as being inadequate – see for instance Pyke (2015) and Boulanger (2016) – and these analyses have indicated a potential shoreline stability problem. These simplified methods are at best screening analyses, but the two methods used by the project geotechnical consultant are so flawed that it is doubtful whether they are useful even for that. In addition to the large uncertainty which comes from their being based on large collections of earthquake records, the Bray and Travasarou procedure has the curious feature that when the stiffness is increased, the deformation increases rather than decreases, and the NCHRP method is independent of earthquake magnitude or duration, which cannot be correct.
There are several references in the bid documents to a further deformation analysis which makes use of the finite element program PLAXIS to conduct nonlinear deformation analyses with site-specific earthquake acceleration histories as input, but that report is not included in the bid documents. In any case, the bid documents indicate that the PLAXIS analyses were only two-dimensional and I will demonstrate subsequently why 2D analyses are rather conservative for addressing the Treasure Island shoreline stability problem.
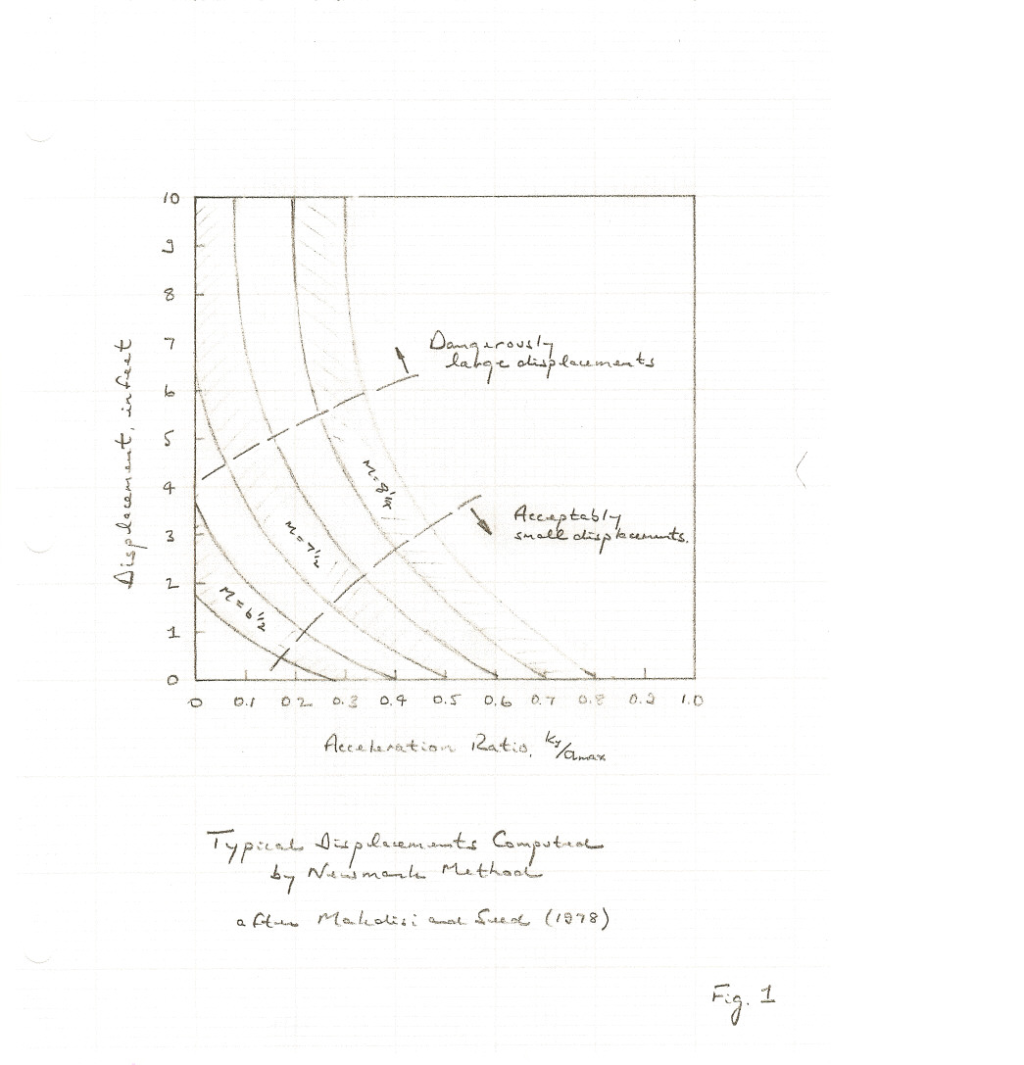
This raises the question of whether in the meantime there is any screening analysis that is appropriate for this site. The short answer is yes, there is. As explained by Harry Seed in his Rankine lecture (Seed, 1979), for materials that do not undergo a loss of strength and stiffness as a result of cyclic loading, pseudo-static analyses are not too bad. That in turn raises the question of what seismic coefficient should be used in a pseudo-static analysis but a robust answer to that is provided in Pyke (1991), which drew on the work of Makdisi and Seed (1978). Or, alternately one can use Makdisi and Seed (1978), which has less shortcomings than any other simplified method for computing deformations. Strictly speaking Makdisi and Seed only applies to dams ranging in height from 50 to 250 feet, but the Treasure Island revetment falls near the lower end of this range.
Both pseudo-static and Makdisi and Seed analyses require knowledge of the expected peak acceleration and the earthquake magnitude. Conservatively assuming up to a magnitude 7.3 earthquake on the combined Hayward – Rogers Creek fault and an up to magnitude 8.1 earthquake on the San Andreas fault, the project geotechnical consultant computed a peak acceleration for the site of 0.46 g using the computer program SHAKE to perform an equivalent linear site response analyses. This value is likely conservative – nonlinear analyses would provide lower values – but I have used this value in the analysis described below.
I have used TSLOPE to compute both the static factor of safety and the yield acceleration (the seismic coefficient that reduces the factor of safety to unity – the factor of safety for a specified seismic coefficient can be derived from this) for Section D-D’. For Section D-D’, when a circular slip circle is transformed to a spherical or ellipsoidal slip surface, two things happen. One is that the slip surface now has to cut through the rock revetment, rather than diving under it – this will increase the factor of safety. The other is that relatively more of the slip surface will be in the young Bay Mud – this might either reduce or increase the factor of safety.
I have used both the methods of solution that are available in TSLOPE – the Ordinary Method of Columns (OMC), which I prefer because it implies that the potential sliding mass is a deformable body, and Spencer’s Method, which is generally preferred by academics because it “fully satisfies equilibrium”, which implies a rigid body. Because hard data are not available for many of the required properties, I have used my judgement, based on 40 plus years of local practice, where necessary. For the young Bay Mud layer I have adopted the project geotechnical consultant’s value of 0.3 for the ratio of the undrained shear strength divided by the effective vertical stress and I have divided the young Bay Mud layer into four zones for purposes of computing its undrained shear strength. For the zone that is going to be overconsolidated by wicking and surcharging I have increased the undrained shear strength by 50 percent, corresponding to an OCR value of a little more than 1.5. For the other zones I have assumed that the Bay Mud is normally consolidated under the current overburden. I have conservatively assumed that the lower strength sand layer extends to under the heel of the lower triangle of rockfill, even though I believe that some or all of this material can be densified. For the “static” loading case I have used undrained strengths in the young Bay Mud and drained strengths in the other materials.
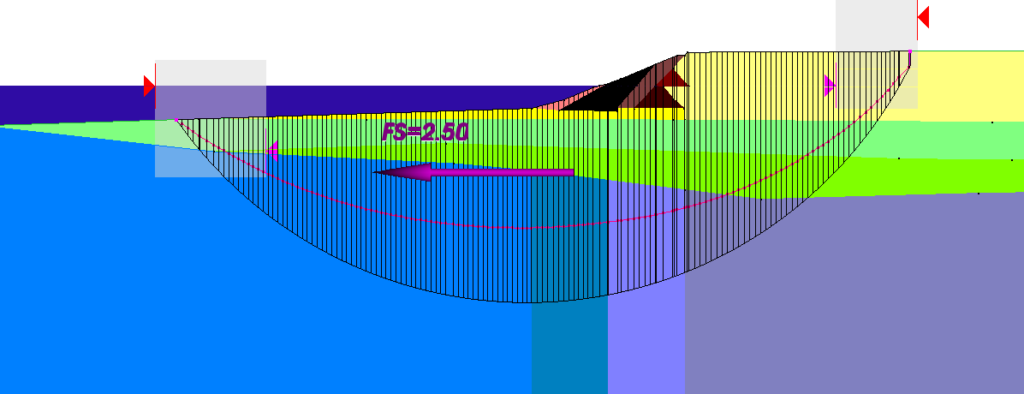
Figure 2 – Critical Slip Circle Using “Static” Properties
For the “seismic” loading case I have used undrained strengths for all materials below the water table, except for the rockfill in the revetment. I have also corrected these strengths for rate of loading effects in order to represent the short rise time of an earthquake pulse. These corrections are based on UC Berkeley Ph.D. theses by Gerry Thiers and Willie Lacerda as well as other data reported by Pyke (1981) and Bea (1999). For the shoal materials I assumed a base undrained shear strength of 2000 psf based on the test data shown in the bid documents.
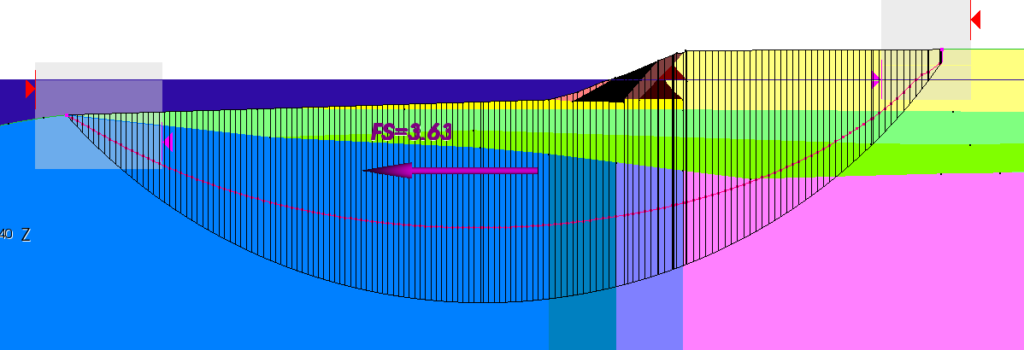
Figure 3 – Critical Slip Circle Using “Seismic” Properties
The critical slip surfaces that are shown in Figures 2 and 3 are both for “static” analyses without the application of a seismic coefficient but use different properties. The critical circular slip surface obtained in the “static” analysis with “seismic” properties was then used in subsequent searches for the yield acceleration. The computed factors of safety by Spencer’s method that are shown on these two figures might be higher than expected by some engineers for slopes in or over young Bay Mud, but they are not that surprising given the consolidation of the young Bay Mud under weight of the existing fill and the planned additional surcharging.
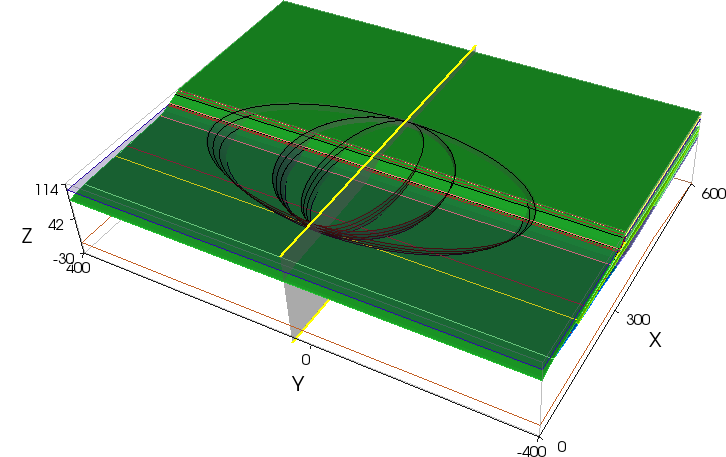
Figure 4 – Top View of 3D Slip Surfaces
The critical 2D failure surface in the static analysis with seismic properties was also used as the basis for constructing three 3D failure surfaces, as shown in Figure 4. The central 3D slip surface is a sphere, which has an aspect ratio of 1.0. In addition there are two further ellipsoids that have aspect ratios of 0.5 and 2.0. The larger the aspect ratio, the more the 3D solution approaches the 2 D solution. Of the four cases, the one with the aspect ratio of 0.5, which gives the highest factor of safety, is probably the most like an actual landslide.
The computed factors of safety are shown in Table 1. As expected for a slope that has been stable for many years and would have been at greatest risk at the end of construction, the static factors of safety are healthy enough to suggest that there is some margin of safety to accommodate earthquake loadings.
Table 1 – Computed Factors of Safety
Recall that the design peak acceleration for the site is a conservative 0.46g. At most, the seismic coefficient that should be used in a pseudo-static analysis is half that, or, conservatively, 0.23g (see Pyke, 1991). That would be for a magnitude 8 earthquake on the San Andreas fault. Except for the 2D analysis using the OMC, all the yield accelerations (the seismic coefficient that reduces the factor of safety to unity) are greater than 0.25, implying factors of safety in pseudo-static analyses of more than 1.1, which is the accepted standard in California for passing a “screening analysis”. And, if you meet the screening analysis criteria, you should not be required to attempt more detailed orsophisticated analyses. Taking the yield acceleration for the aspect ratio of 0.5 and the OMC, which in my judgment is the “best” answer, the implied factor of safety using the highest reasonable seismic coefficient in a pseudo-static analysis is 1.5!
I have taken the results below one step further and illustrated the expected seismic displacements shown in Figure 5 using Figure 1 from the “McCrink letter” (Pyke, 1991, which is attached). The computed ratios of the yield acceleration divided by the peak acceleration range from about 0.5 to about 0.75, with the higher values likely being more correct. Thus, the expected displacements from both San Andreas and Hayward fault events are small, less than 1 foot, and in the worst case the San Andreas displacements might be something like 2 feet. These seem like entirely reasonable results for the site after densification of the sand fill and wicking and surcharging of the yBM. There is no precedent for failure of a fill over young Bay Mud many years after the initial construction when the young Bay Mud has fully consolidated, let alone when it has been overconsolidated by wicking and surcharging, even in the Loma Prieta earthquake which generated strong ground motions around at least parts of the Bay.
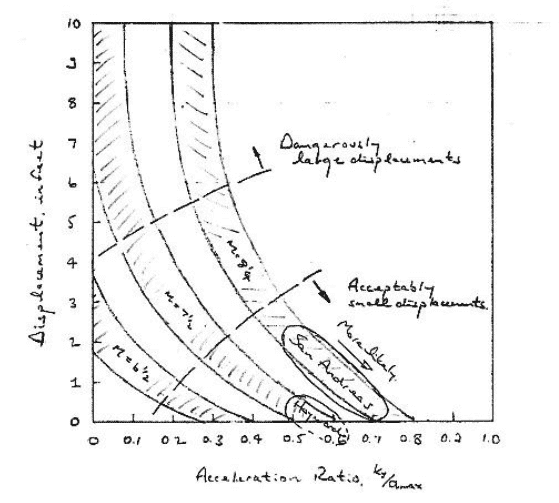
Figure 5 – Simplified Calculation of Seismic Displacements
Conclusions
Simplified analyses using conventional procedures and 2D slope stability analyses can be unnecessarily conservative, and in this case suggest that there is a problem where no problem exists. In a case like this, there is no good argument for requiring any further analyses even if an extensive field and laboratory investigation were to be undertaken to acquire the kind of data that would be needed.
Furthermore, in a case like this any effort that is made to improve shoreline stability, say by introducing relatively stiff soil-cement walls or cells, is likely to worsen the situation rather than improving it. Such measures would surely result in longitudinal cracking as a result of strain incompatibility and would likely increase the tendency for the revetment to shed into the Bay. Requiring the construction of soil-cement walls or cells when they are not in fact needed would have adverse effects on schedule and introduce unnecessary headaches with regard to construction quality control.
This case history illustrates how use of 3D slope stability analyses can in some cases lead to significant economies without sacrificing safety. However, there may be other cases where a particular geometry or geology allows a failure to occur in 3D that is not seen in a 2D cross section, so the more general lesson is you don’t know the effect of 3D geometry on slope stability unless you check it out.
References
Baligh, M.M., and Azzouz, A.S., “End Effects on Cohesive Slopes”, Journal of Geotechnical Engineering, ASCE, Volume 101, No. 11, 1975
Bea, R.G., et al. “Evaluation of Reliability of Platform Pile Foundations”, Journal of Geotechnical and Geoenvironmental Engineering, ASCE, Vol. 125 No.8, August 1999
Boulanger, R.W., “Lateral Spreading in Interbedded Sand, Silt and Clay Deposits, Cark Canal”, Idriss Symposium, UC Davis, June 17, 2016
Brown, I.R., “3D Slope Stability Analyses of a Zoned Earth Fill Dam”, www.tagasoft.com, 2016
Hungr, O., Salgado, F.M. and Byrne, P.M., “Evaluation of a Three-Dimensional Method of Slope Stability Analysis”, Canadian Geotechnical Journal, Vol. 26, pp. 679-686, 1989
Makdisi. F.I., and Seed, H.B., “Simplified Procedure for Estimating Dam and Embankment Earthquake-Induced Deformations”, Journal of Geotechnical Engineering, ASCE, Vol.104, No.GT7, July 1978
Mitchell, J.K., “Practical Problems from Surprising Soil Behaviour – the Twentieth Terzaghi Lecture”, Journal of Geotechnical Engineering, ASCE, Vol. 112, No. 3, pp. 255–289, 1986
Pyke, R., “A Preliminary Study of Rate of Loading Effects on Axial Pile Capacities”, Report prepared for Union Oil Company Science and Technology Division, December 1981
Pyke, R., “Selection of Peak Acceleration Values and Seismic Coefficients”, letter to Tim McCrink of the California Division of Mines and Geology, October 1991
Pyke, R., et al., “Modeling of Dynamic Soil Properties”, Appendix 7.A, Guidelines for Determining Design Basis Ground Motions, Report No. TR-102293, Electric Power Research Institute, November 1993
Pyke, R., “Evaluating the Potential for Earthquake-Induced Liquefaction in Practice”, 6th International Conference on Earthquake Geotechnical Engineering, Christchurch, New Zealand, November 2015
Pyke, R., “Pros and Cons of the Analysis of Slope Stability by Various Methods of Slices or Columns”, http://rpce.us, 2017
Schmertmann, J.H., “The Mechanical Ageing of Soils – the Twenty Fifth Terzaghi Lecture”, Journal of Geotechnical Engineering, ASCE, Vol. 117, No. 9, 1991
Seed, H.B., “Nineteenth Rankine Lecture: Consideration in the Earthquake Resistant Design of Earth and Rockfill Dams”, Geotechnique, Vol.24, No.3, September 1979
Vahdani, S., Egan, J., Pyke, R., “Seismic Design Ground Motion and Site Response Analysis Procedure Prepared for Port of Oakland”, report prepared by Geotechnical Seismic Design Review Board, 2002