Reinforced Hillside Slope Assessment Using TSLOPE
This case study shows how TSLOPE was used to assess a steep hillside that had previously experienced shallow instability and to test the effect of proposed piles, ground anchors and a concrete deck.
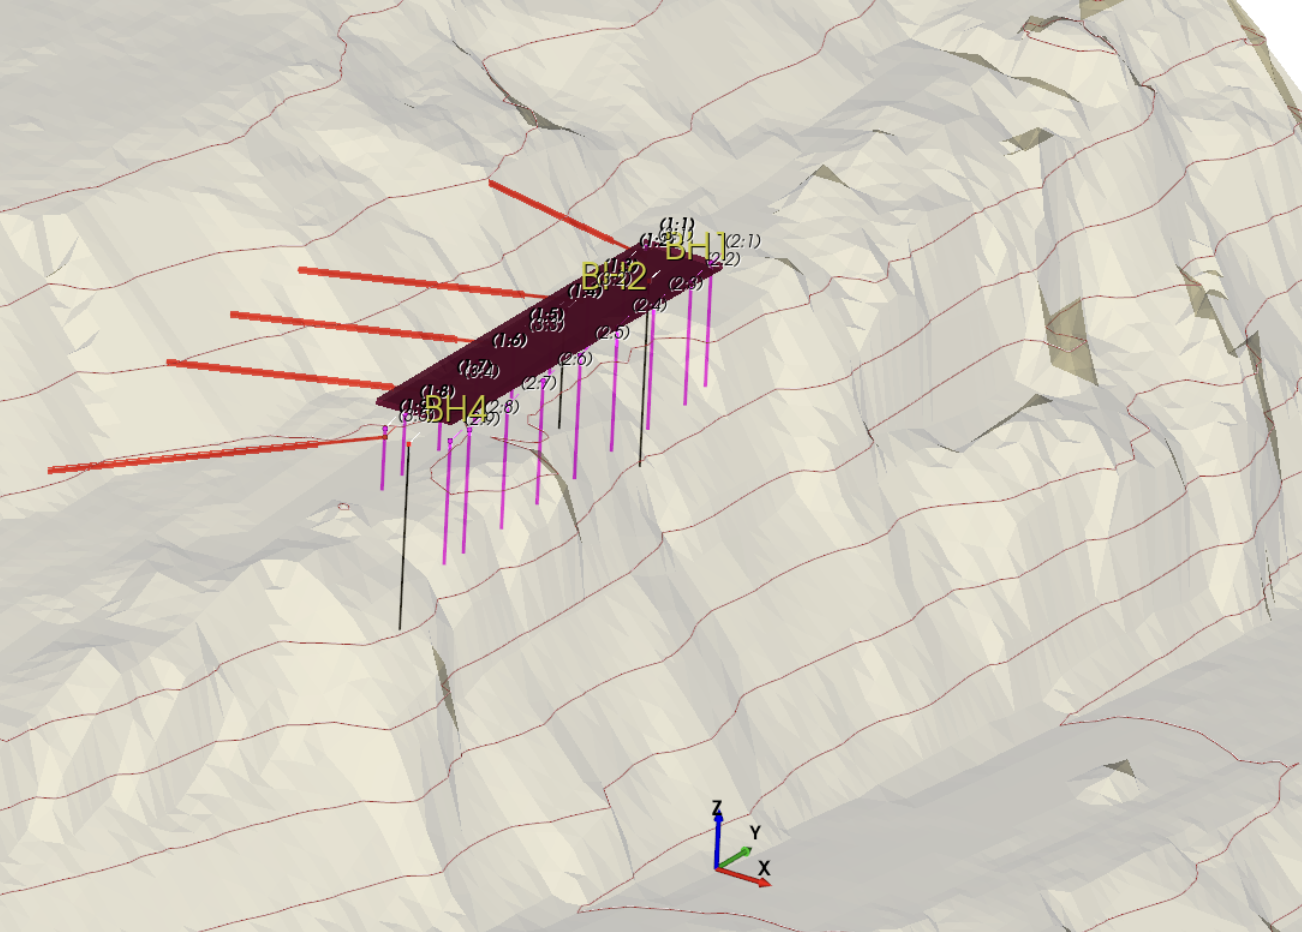
The engineering team combined detailed terrain data, investigation information, structural loads and reinforcement elements in one 3D limit equilibrium model. Equivalent 2D cases were also analysed to provide a direct comparison.
Static analysis of the existing slope configuration.
Static analysis with piles, anchors and deck loading included.
Approximate increase in the calculated 3D static factor of safety.
Reinforced slope under the adopted earthquake loading.
Project Context
The steep site had previously been affected by a shallow landslide involving near-surface materials. The instability was associated with overland water flow, which had subsequently been brought under control.
Before the proposed building work could proceed, the engineering team needed to assess the existing slope and demonstrate how the proposed structural works would affect stability under both static and earthquake loading.
- Assess the stability of the existing slope
- Represent the steep and irregular three-dimensional terrain
- Include piles, ground anchors and a proposed concrete deck
- Apply both static and seismic loading
- Compare 2D and 3D factors of safety
Building the TSLOPE Model
The ground model was developed using LiDAR terrain data supplemented by updated UAV point-cloud information. This allowed the analysis to reflect the real shape of the slope rather than relying on a simplified or idealised profile.
Site investigation boreholes, the mapped extent of the previous landslide and the proposed structural elements were then positioned within the model.
Geotechnical assumptions
- One material representing weathered greywacke
- Generalised Hoek-Brown failure criterion
- Dry slope conditions
- No groundwater observed in the investigation boreholes or exposed slope face
Structural inputs
- Concrete deck modelled as an 8.5 kPa vertical uniform load
- Ground anchor tension capacity of 245 kN
- Pile shear capacity of 270 kN
- Reinforcement positioned using the proposed design geometry
Assessing the Existing Slope
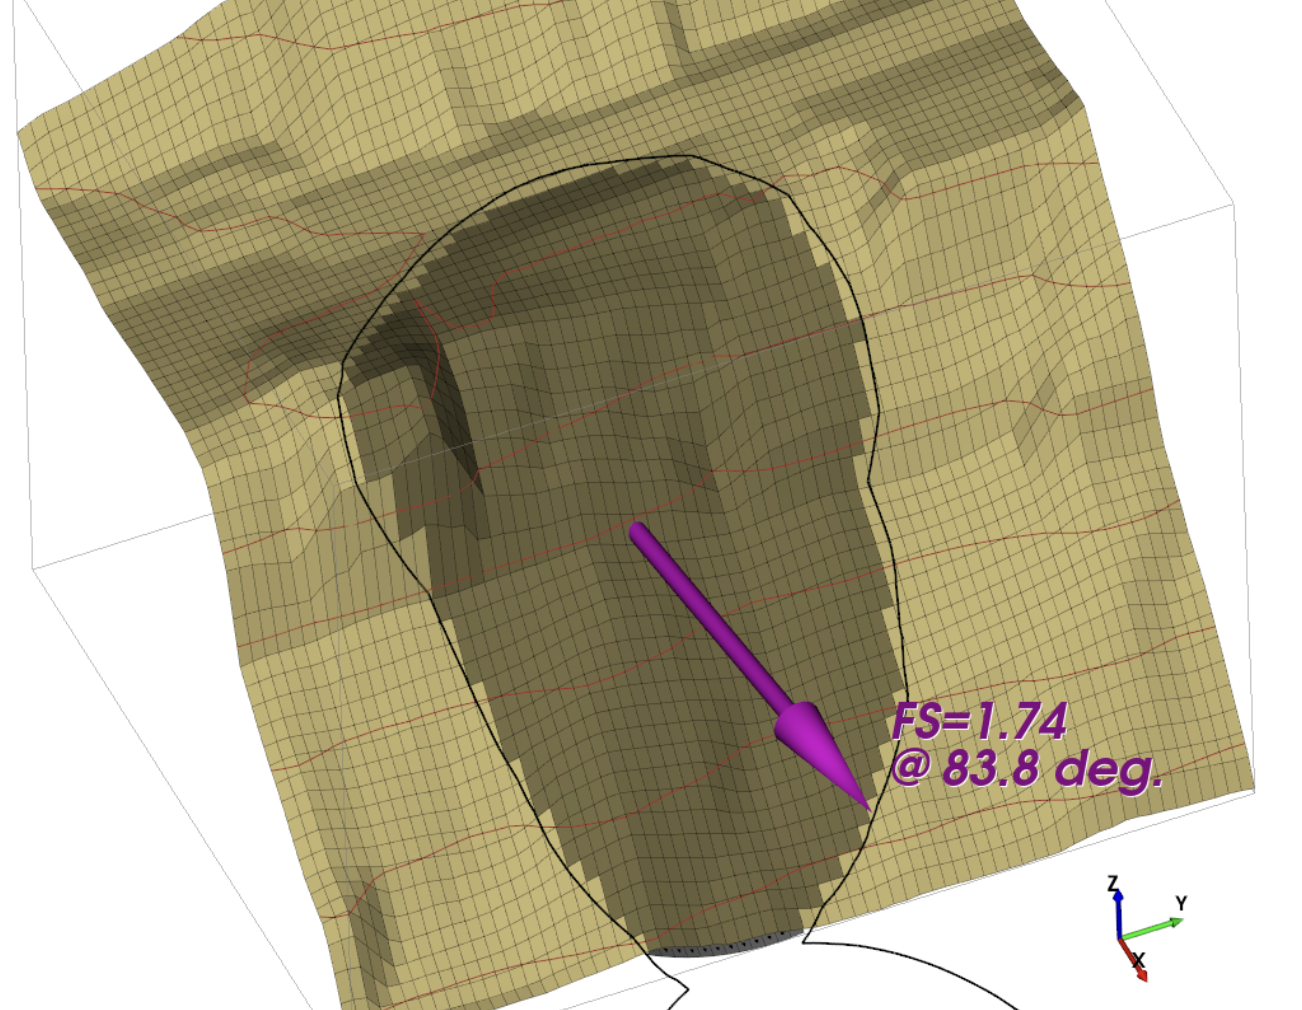
A 2D search was first used to identify a critical slip surface with the lowest calculated factor of safety. An equivalent failure surface was then assessed using the complete 3D terrain model.
The existing slope returned a 2D static factor of safety of 1.63 and a 3D static factor of safety of 1.74.
Why the 3D assessment mattered
The hillside had irregular terrain and a limited potential failure width. A single 2D section could represent the slope profile, but it could not fully account for resistance around the sides of the potential sliding mass.
The 3D model allowed the engineer to assess the complete failure surface and calculate its sliding direction across the actual terrain.
Testing the Reinforced Slope
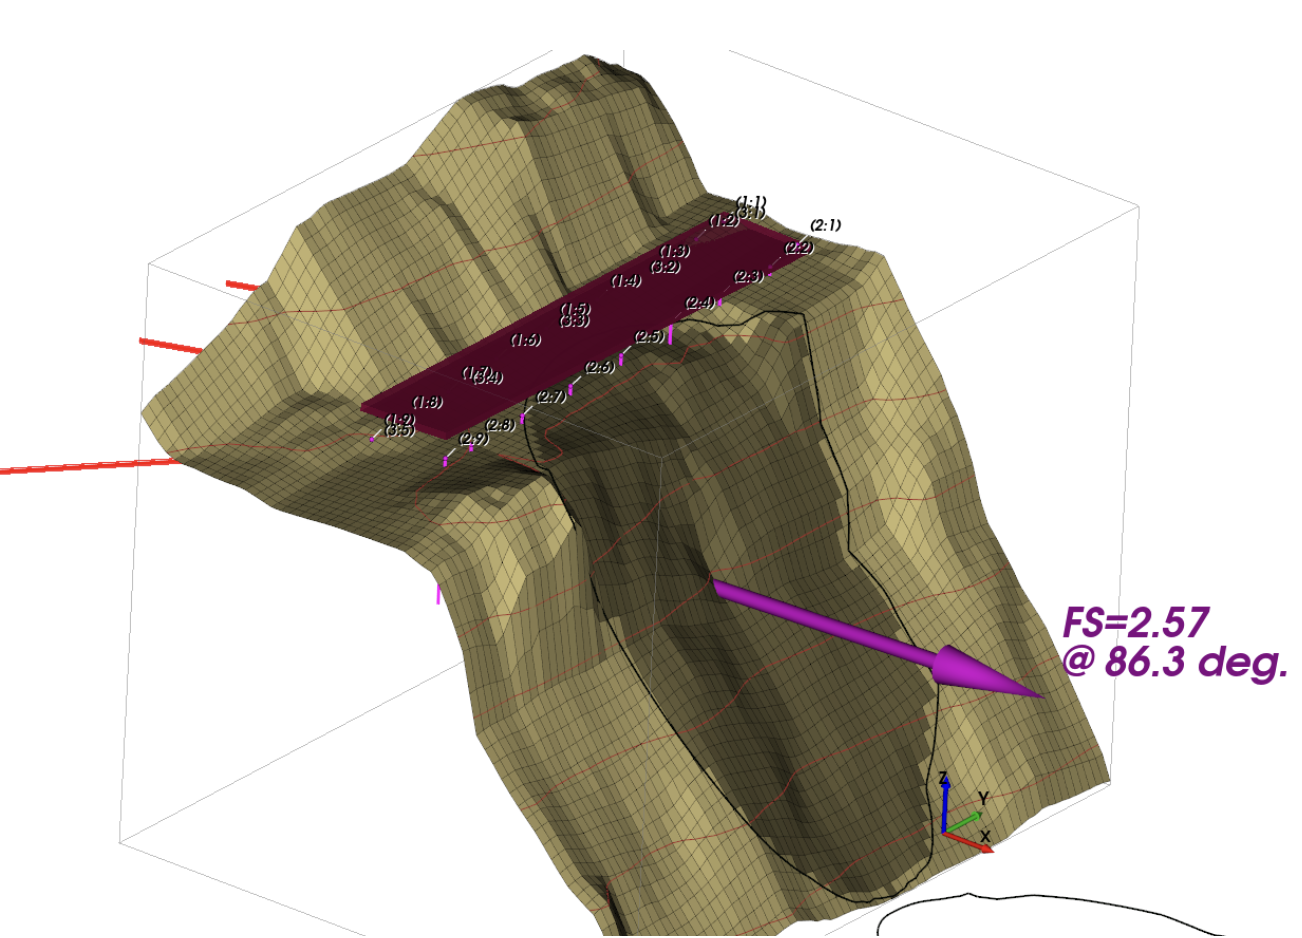
The piles, ground anchors and deck load were added to the analysis to test the completed design. Under static loading, the calculated factor of safety increased in both the 2D and 3D cases.
Static analysis results
The reinforced 2D model returned a factor of safety of 2.03, compared with 1.63 for the existing slope.
In 3D, the factor of safety increased from 1.74 to 2.57. This represented an increase of approximately 48% in the calculated static factor of safety.
Earthquake Loading
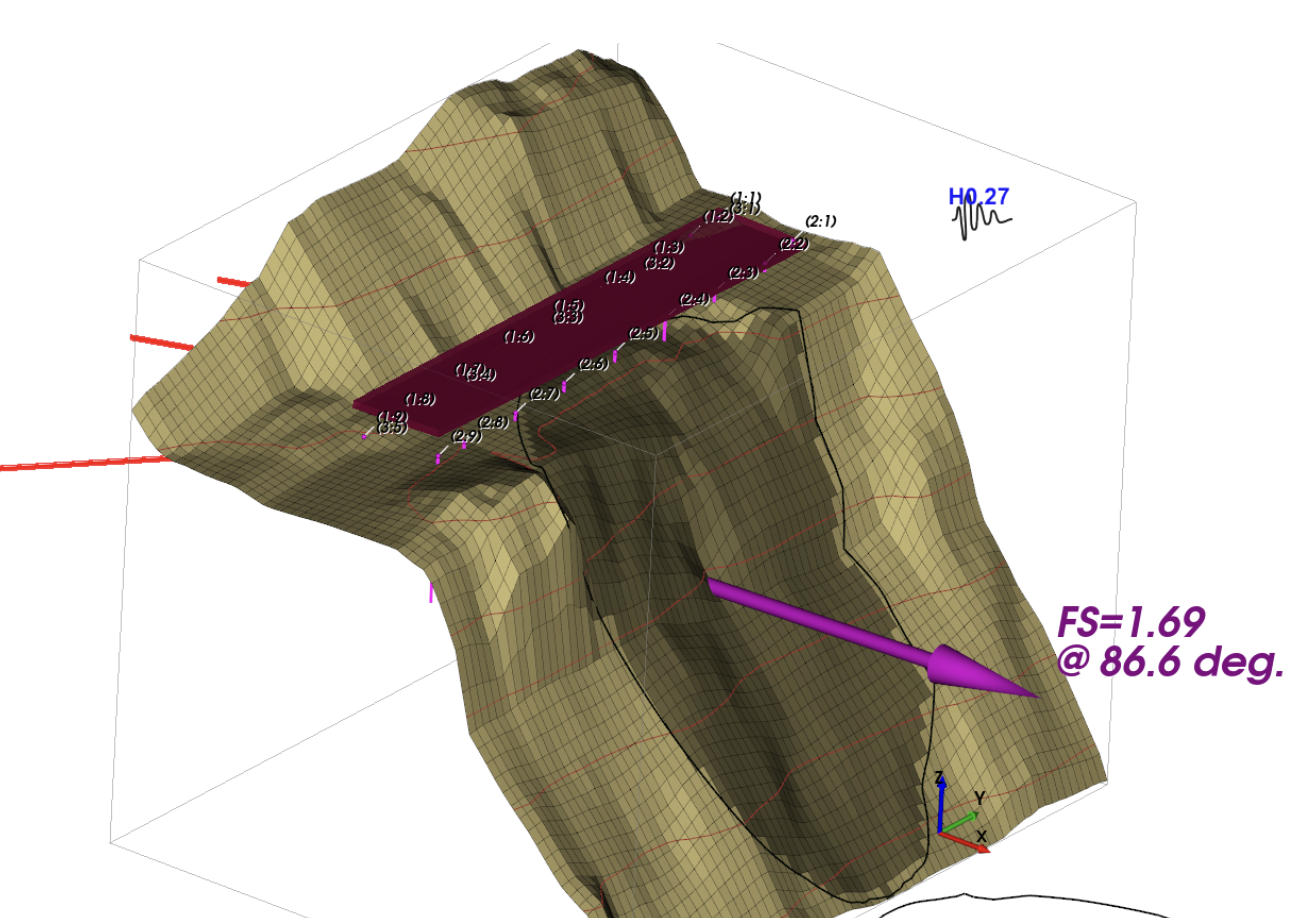
The reinforced slope was also assessed under the project’s Ultimate Limit State earthquake requirements. A horizontal seismic coefficient of 0.23 was applied to the limit equilibrium analyses.
The reinforced 2D case returned a factor of safety of 1.38, while the full 3D earthquake case returned a factor of safety of 1.69.
Seismic analysis results
- Reinforced 2D earthquake factor of safety: 1.38
- Reinforced 3D earthquake factor of safety: 1.69
- Calculated 3D sliding direction: approximately 86.6 degrees
- Proposed reinforcement remained included throughout the seismic assessment
The 3D model again produced a higher factor of safety because it accounted for the complete terrain geometry and resistance around the potential sliding mass.
Results Summary
Comparing the existing and reinforced models showed that the proposed works increased the calculated stability of the slope under static loading and retained adequate stability under the adopted earthquake case.
| Slope condition | 2D static | 2D earthquake | 3D static | 3D earthquake |
|---|---|---|---|---|
| Existing slope | 1.63 | Not assessed | 1.74 | Not assessed |
| Reinforced slope | 2.03 | 1.38 | 2.57 | 1.69 |
This case study shows how TSLOPE can test real reinforcement geometry and structural loading within a complete 3D slope model.
Outcome
The analysis showed that the proposed piles and ground anchors substantially increased the calculated stability of the slope. It also demonstrated that the reinforced slope retained adequate stability under the adopted earthquake loading.
By assessing the project in both 2D and 3D, the engineering team could compare the traditional cross-section result against the behaviour of the complete slope.
- Real terrain created from LiDAR and UAV data
- 2D and 3D analysis within the same workflow
- Piles and anchors represented in their proposed positions
- Structural and seismic loads incorporated directly
- Clear comparison between existing and reinforced conditions
Model Complex Slopes in 2D and 3D
TSLOPE gives engineers one environment for building real terrain models, testing reinforcement and comparing 2D and 3D slope stability results.