Technical Notes

Practical notes for slope stability modelling.

Short technical explainers for geotechnical engineers reviewing slope stability models, checking assumptions, and interpreting results beyond the headline factor of safety.

Analysis review

Model Review and Analysis Checks in TSLOPE

Factor of safety is the headline result in slope stability analysis, but it is not the whole story. Engineers also need to understand why a model is behaving the way it is, whether the assumptions are reasonable, and whether the results make engineering sense.

Why model review matters

Slope stability software can calculate results quickly, but the quality of those results still depends on the geometry, material parameters, groundwater assumptions, loading, and failure mechanism used in the model. A factor of safety can look acceptable while the model itself still deserves closer review.

Visual checks help engineers move beyond a single number. They can show where forces are concentrating, how the assumed slip surface is behaving, and whether parts of the model may need further investigation.

In short: the result tells you what the model calculated. The review helps you decide whether the result is useful.

Common checks when reviewing a slope stability model

1. Check the failure mechanism

The first question is whether the failure mechanism makes sense for the site. A low factor of safety may be technically correct for the model, but the assumed mechanism still needs to be realistic for the geology, ground profile, structure, and loading conditions.

  • Does the slip surface follow a plausible weak layer or geological contact?
  • Does the failure mechanism match observed site behaviour?
  • Does the result change significantly between 2D and 3D analysis?
  • Is the critical mechanism controlled by geometry, groundwater, loading, or material strength?

2. Review stress distribution

Stress distribution can help show whether the model is behaving as expected. Concentrations near the toe, crest, weak layers, or interfaces can help engineers understand what is driving the result.

This is particularly useful when comparing options such as drainage, reinforcement, load management, toe support, or changes to slope geometry.

3. Look for tension issues

Tension between slices or columns may indicate that the assumed internal force system needs closer review. In limit equilibrium analysis, this can be a useful warning sign that the result should not be accepted without checking the model assumptions.

The presence of tension does not automatically make a model unusable, but it does tell the engineer where to look more closely.

4. Check weak layer influence

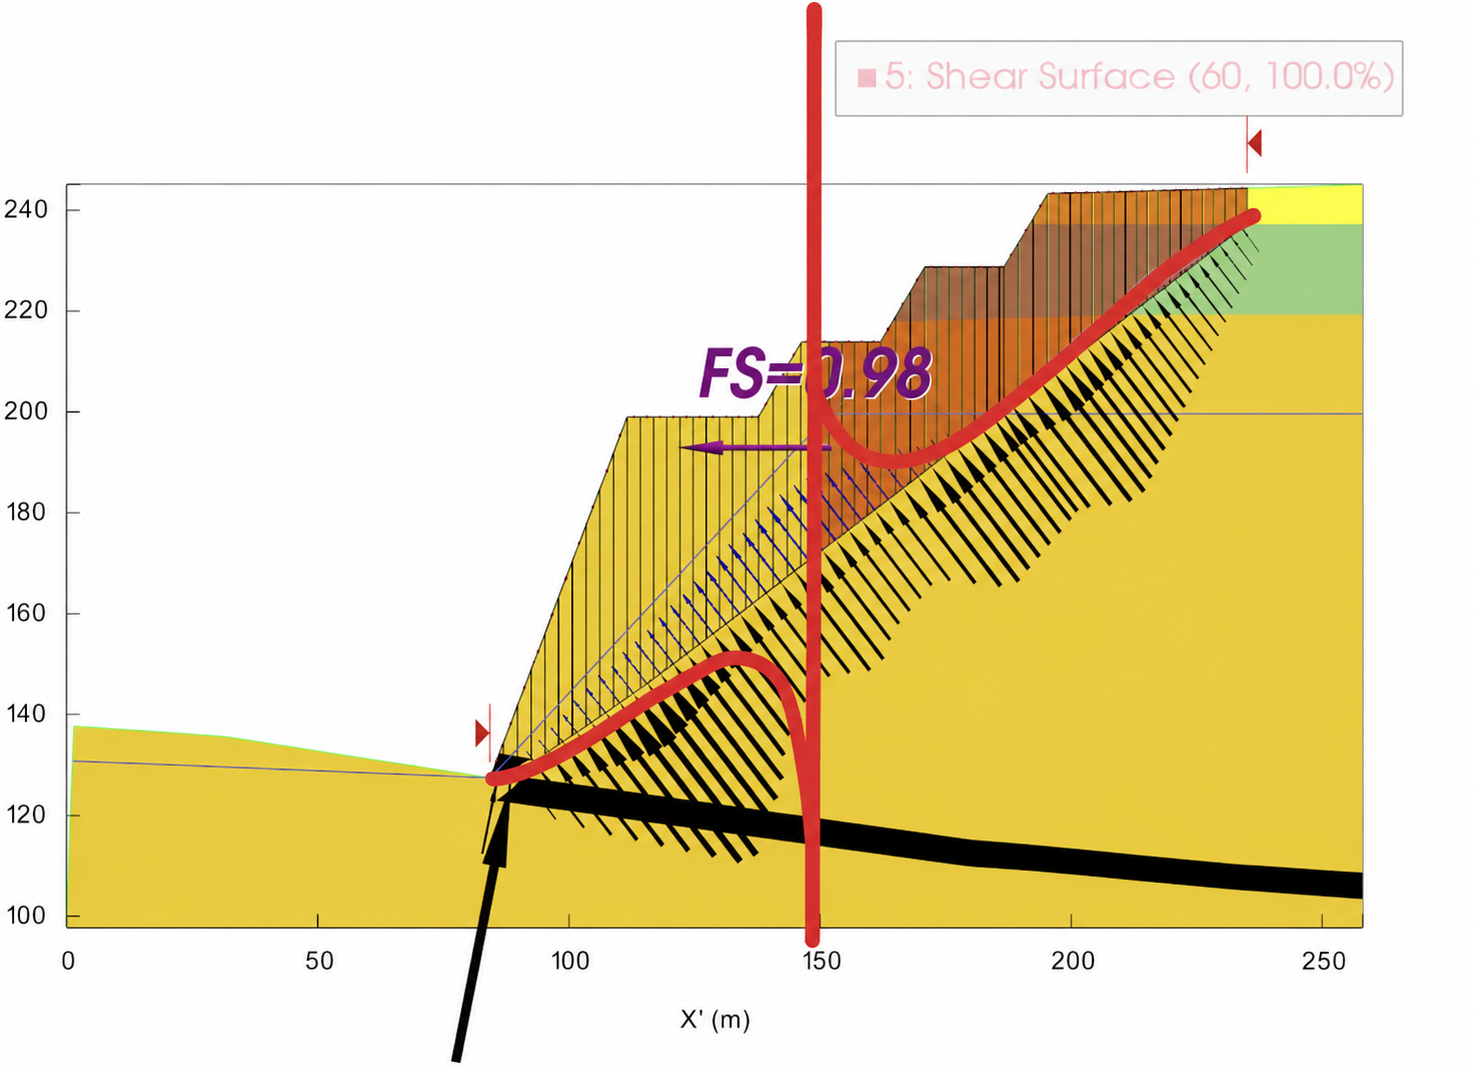
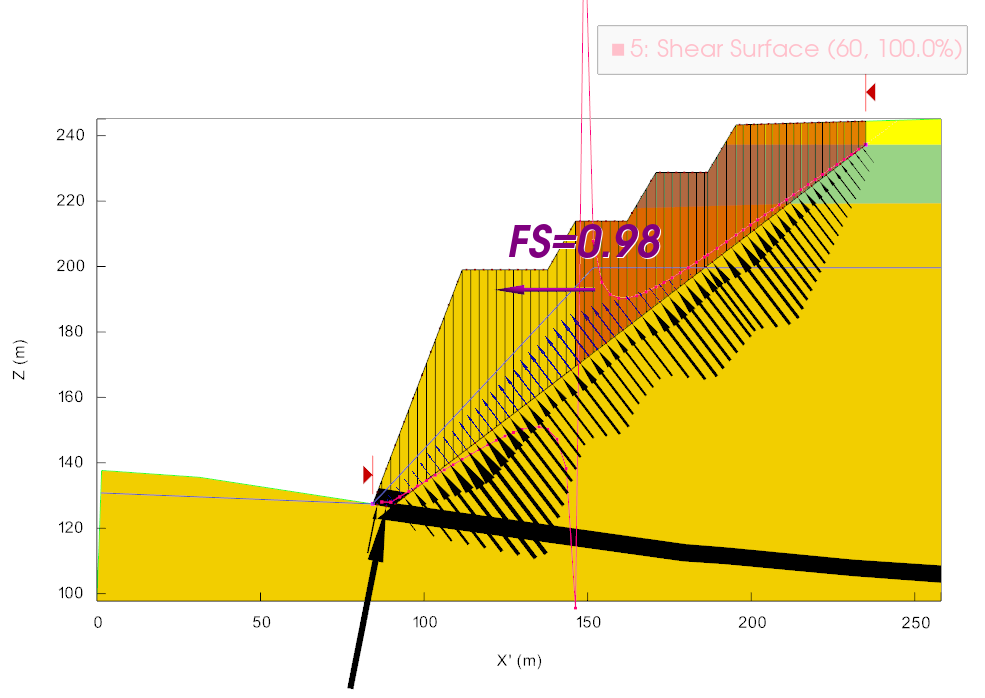
Weak layers can strongly control the failure surface and the calculated factor of safety. A visual review can help confirm whether the critical mechanism is genuinely following the weak layer, partly influenced by it, or being controlled by another part of the model.

  • Review whether the slip surface follows the intended weak layer.
  • Check whether small geometry changes cause large result changes.
  • Compare results with and without the weak layer where appropriate.
  • Review whether material strengths reflect the expected site conditions.

5. Compare 2D and 3D behaviour

A 2D analysis can be useful, but it may not capture the full behaviour of a three-dimensional slope. Comparing 2D and 3D results can help engineers identify where 3D geometry, side resistance, variable geology, or non-uniform loading changes the interpretation.

This is one of the areas where visual review is particularly valuable. The factor of safety may change, but the more important question is often why it changed.

Using TSLOPE for model review

TSLOPE supports engineers by making it easier to review 2D and 3D slope stability behaviour visually. Instead of relying only on the final factor of safety, users can examine the geometry, slip surface, stress distribution, tension checks, and model response.

This helps engineers identify modelling issues earlier, explain results more clearly, and make better decisions about what to test next.

The aim is not to replace engineering judgement. The aim is to give engineers better information so they can apply that judgement more effectively.

Conclusion

Model review is a practical part of slope stability analysis. Factor of safety matters, but it should sit alongside checks on geometry, assumptions, mechanism, stress distribution, tension, and weak layer influence.

By reviewing the behaviour behind the result, engineers can build more reliable models and communicate slope stability risks more clearly.

Back to top

Limit equilibrium

Understanding the Line of Thrust in Limit Equilibrium Slope Stability Analysis

In slope stability analysis, engineers often focus on the factor of safety. The line of thrust provides another layer of interpretation by helping engineers understand how internal forces are transferred through the potential sliding mass.

What is the line of thrust?

The line of thrust is an interpreted path through the sliding mass that represents the resultant of internal forces. It gives engineers a way to consider how force transfer is occurring within the assumed failure mechanism.

In structural mechanics, thrust lines are often used to show the flow of compressive forces through arches and similar structures. In slope stability analysis, the principle is different in detail, but the basic idea is similar: the line helps illustrate where the internal force resultants act within the analysed mass.

In short: the factor of safety gives the headline result. The line of thrust helps explain the internal force path behind that result.

Role in limit equilibrium methods

Limit equilibrium methods, including approaches such as Spencer’s method and Morgenstern-Price, use assumptions about interslice or intercolumn forces. The line of thrust can help engineers interpret the consequences of those assumptions.

It is not a standalone proof that a slope is safe or unsafe. Instead, it is one way to check whether the internal force behaviour appears reasonable for the model being analysed.

What the line of thrust can help show

Circular slip surfaces

For circular slip surfaces, the thrust path may arc through the sliding mass and often gives useful insight into how the assumed force system is developing toward the toe.

Non-circular slip surfaces

For non-circular slip surfaces, the thrust path can help reveal how force transfer is influenced by irregular geometry, weak interfaces, or changes in material strength.

Force function assumptions

In methods such as Morgenstern-Price, the selected force function affects the distribution of interslice forces. Reviewing the line of thrust can help engineers understand how that assumption influences the calculated result.

Why it matters

1. It supports result checking

The line of thrust can help engineers check whether the analysis is behaving in a way that makes engineering sense. This is especially useful when a factor of safety looks unexpected or when the result is sensitive to assumptions.

2. It helps identify critical zones

If the thrust path sits outside the sliding volume, or if internal force behaviour appears concentrated near the toe, crest, weak layer, or another important part of the model, that area may deserve closer review.

3. It improves communication

A visual force path can help explain slope behaviour to clients, reviewers, regulators, or other engineers. It gives context to the factor of safety and helps communicate why a particular mechanism or design response is being considered.

Practical example

For a road embankment, the factor of safety may show whether the analysed slope meets the required target. The line of thrust can help explain where the internal force transfer is occurring within the sliding mass.

If the force path concentrates toward the toe, the engineer may review toe support, drainage, or changes to the slope geometry. If the behaviour is influenced by loading near the crest, surcharge management or crest reinforcement may deserve closer consideration.

The line of thrust does not prescribe the design response by itself. It supports engineering interpretation.

Conclusion

The line of thrust is a useful concept in limit equilibrium slope stability analysis because it helps engineers look beyond the factor of safety and review the force behaviour behind the result.

By considering the line of thrust alongside geometry, material strength, groundwater, loading, and the selected analysis method, engineers can better assess whether a slope stability result makes practical engineering sense.

Back to top

3D slope stability

Why Sliding Direction Matters in 3D Slope Stability Analysis

In 3D slope stability analysis, sliding direction is not just a visual setting. It affects the calculated factor of safety and the way stabilising measures such as anchors should be positioned.

In a 2D section, the direction of movement is usually implied by the section itself. In 3D, the slope can fail in different directions depending on the geometric relationship of the ground surface, basal geometry, weak layers, groundwater, loading, and support. The most obvious downslope direction is not always the direction that produces the lowest factor of safety.

Why direction matters

Sliding direction influences how the software resolves driving and resisting forces. A change in direction can change the calculated factor of safety, even when the same general slope geometry is being analysed.

This matters because engineers are not only asking whether a slope is stable. They are also trying to understand the likely movement direction, the controlling failure mechanism, and what design response makes sense.

What can change when the sliding direction changes?

  • The calculated factor of safety
  • The influence of weak layers or geological structures
  • The interpretation of reinforcement or support requirements
  • The direction anchors or stabilising measures need to act
TSLOPE 3D slope stability model showing a failure mass, factor of safety of 1.72 and sliding direction of 90 degrees

A TSLOPE 3D result showing the modelled failure mass, factor of safety, and associated sliding direction.

The risk of assuming a direction

If the sliding direction is manually assumed, the model may not capture the most critical failure mechanism. A direction that looks reasonable on screen may not be the direction that produces the lowest factor of safety.

This is especially important for complex 3D slopes, including sites with irregular topography, curved batters, non-uniform loading, localised weak zones, or support systems that act in a specific direction.

How TSLOPE handles sliding direction

TSLOPE searches for the sliding direction associated with the lowest factor of safety. Rather than requiring the engineer to manually decide the direction first, TSLOPE identifies the critical direction as part of the 3D analysis process.

That direction feeds into the calculated failure surface and gives engineers a clearer basis for reviewing the result.

In short: TSLOPE identifies the direction associated with the lowest factor of safety rather than relying on a manually assumed movement direction.

Why this matters for anchor design

Anchor direction is not just a drafting choice. Anchors need to act against the likely movement of the sliding mass. If the model assumes the wrong sliding direction, the support layout may not be aligned with the critical mechanism.

By identifying the direction linked to the lowest factor of safety, TSLOPE helps engineers review whether stabilising measures are acting in the right direction for the modelled failure mechanism.

Practical example

For a reinforced slope, two possible sliding directions may appear reasonable from the surface geometry. One direction may follow the general fall of the slope, while another may be controlled by a weak layer, a local geometry change, or the orientation of the basal surface.

A 3D analysis that checks the critical sliding direction can show which direction produces the lower factor of safety. That gives the engineer a better basis for reviewing the failure surface, interpreting the result, and considering anchor orientation.

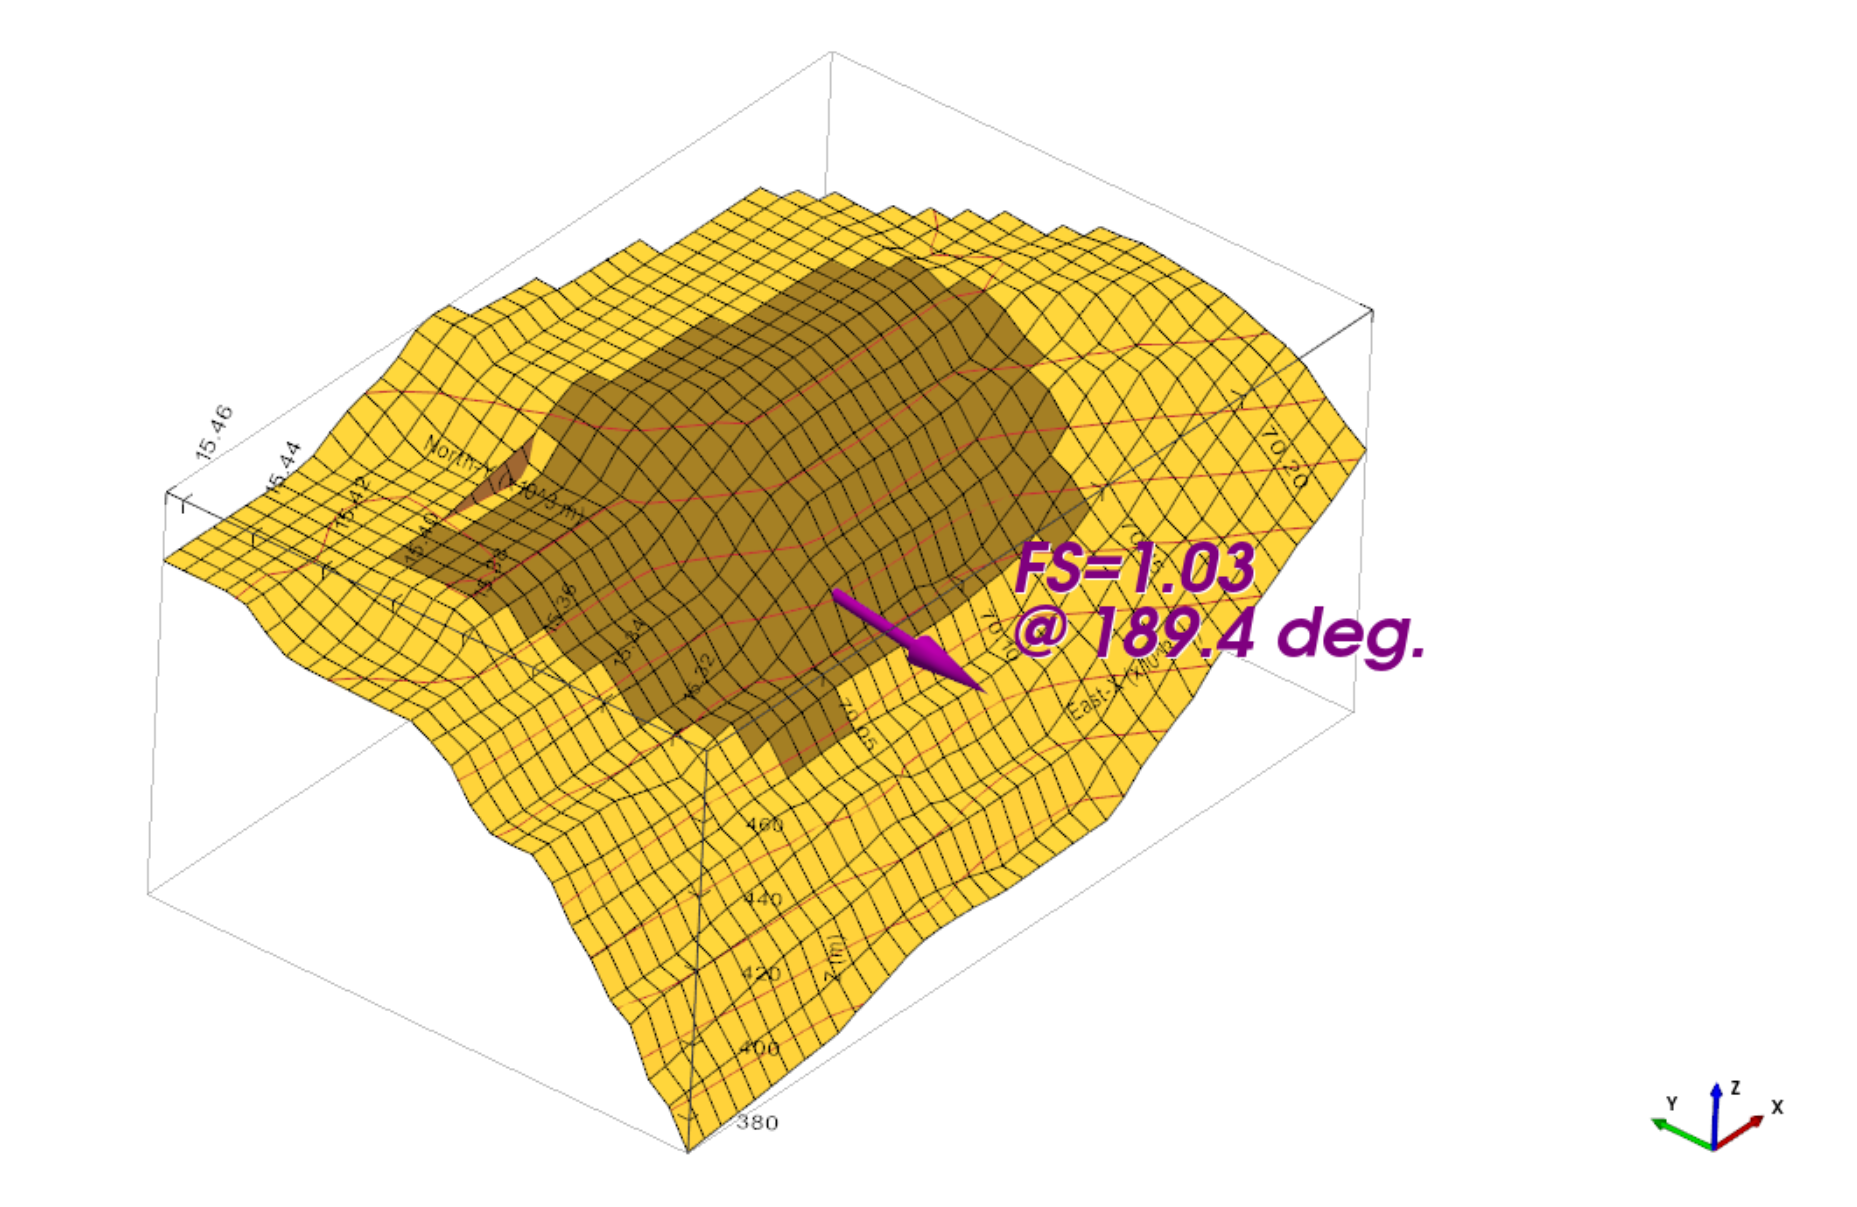
Irregular TSLOPE 3D terrain model showing a failure mass, factor of safety of 1.03 and calculated sliding direction of 189.4 degrees

For irregular 3D terrain, the critical sliding direction may not simply follow the apparent fall of the ground surface.

Conclusion

Sliding direction is a core part of 3D slope stability analysis. It affects the factor of safety and the design interpretation that follows.

TSLOPE identifies the direction associated with the lowest factor of safety, helping engineers review the most critical failure mechanism rather than relying on a manually assumed direction.

Back to top

More notes to come

This section will grow as new modelling questions, support topics, and slope stability interpretation issues come up.

3D search workflows Composite basal surfaces 2D to 3D comparison Groundwater assumptions Weak layer controls Factor of safety interpretation