3D Slope Stability Analysis of a Zoned Earth Fill Dam Using TSLOPE
This case study compares 2D and 3D slope stability analyses for a zoned earth fill dam designed for farm irrigation storage.
The TSLOPE model included the dam geometry, zoned material layers, foundation soils, and a phreatic surface. The analyses compared a 2D critical circular failure surface with equivalent 3D spherical and ellipsoid failure surfaces.
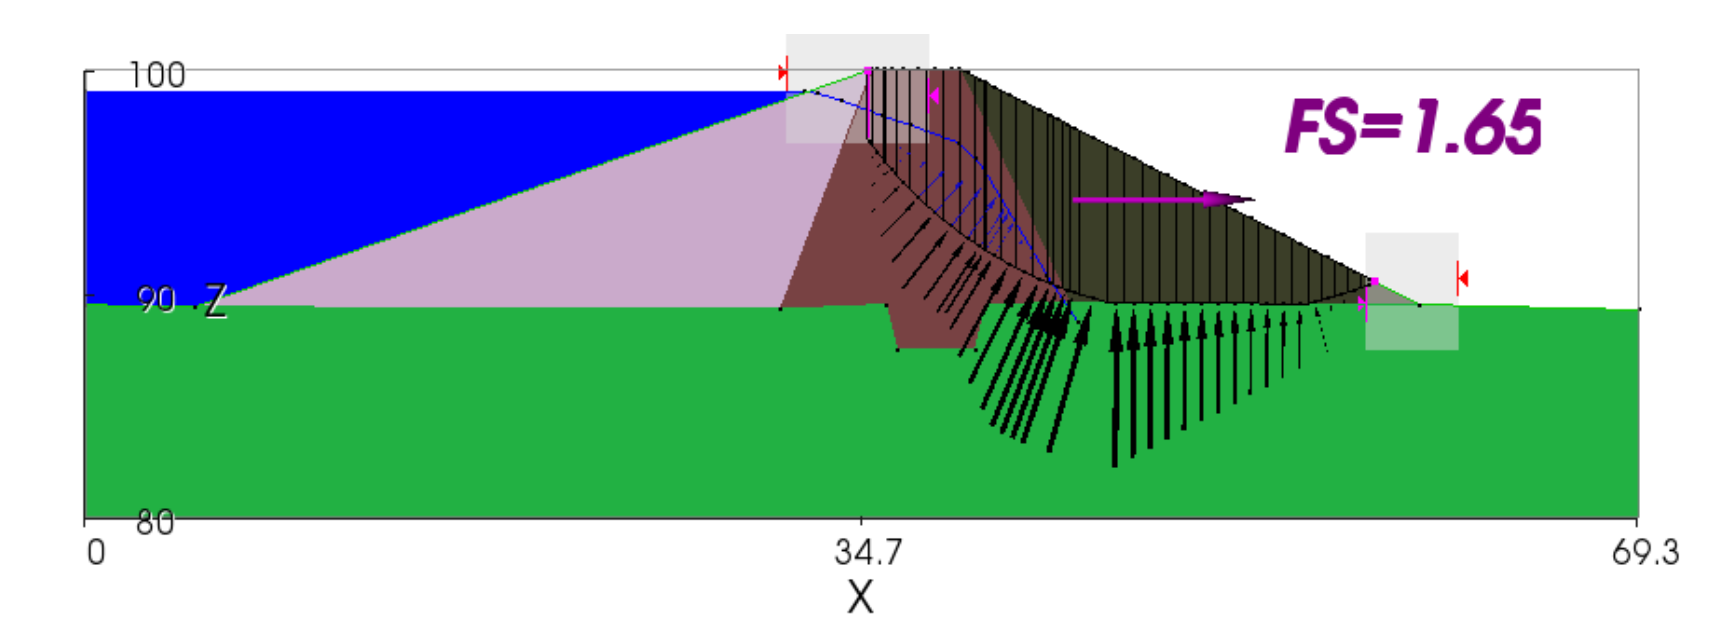
Critical circular failure surface from the 2D analysis.
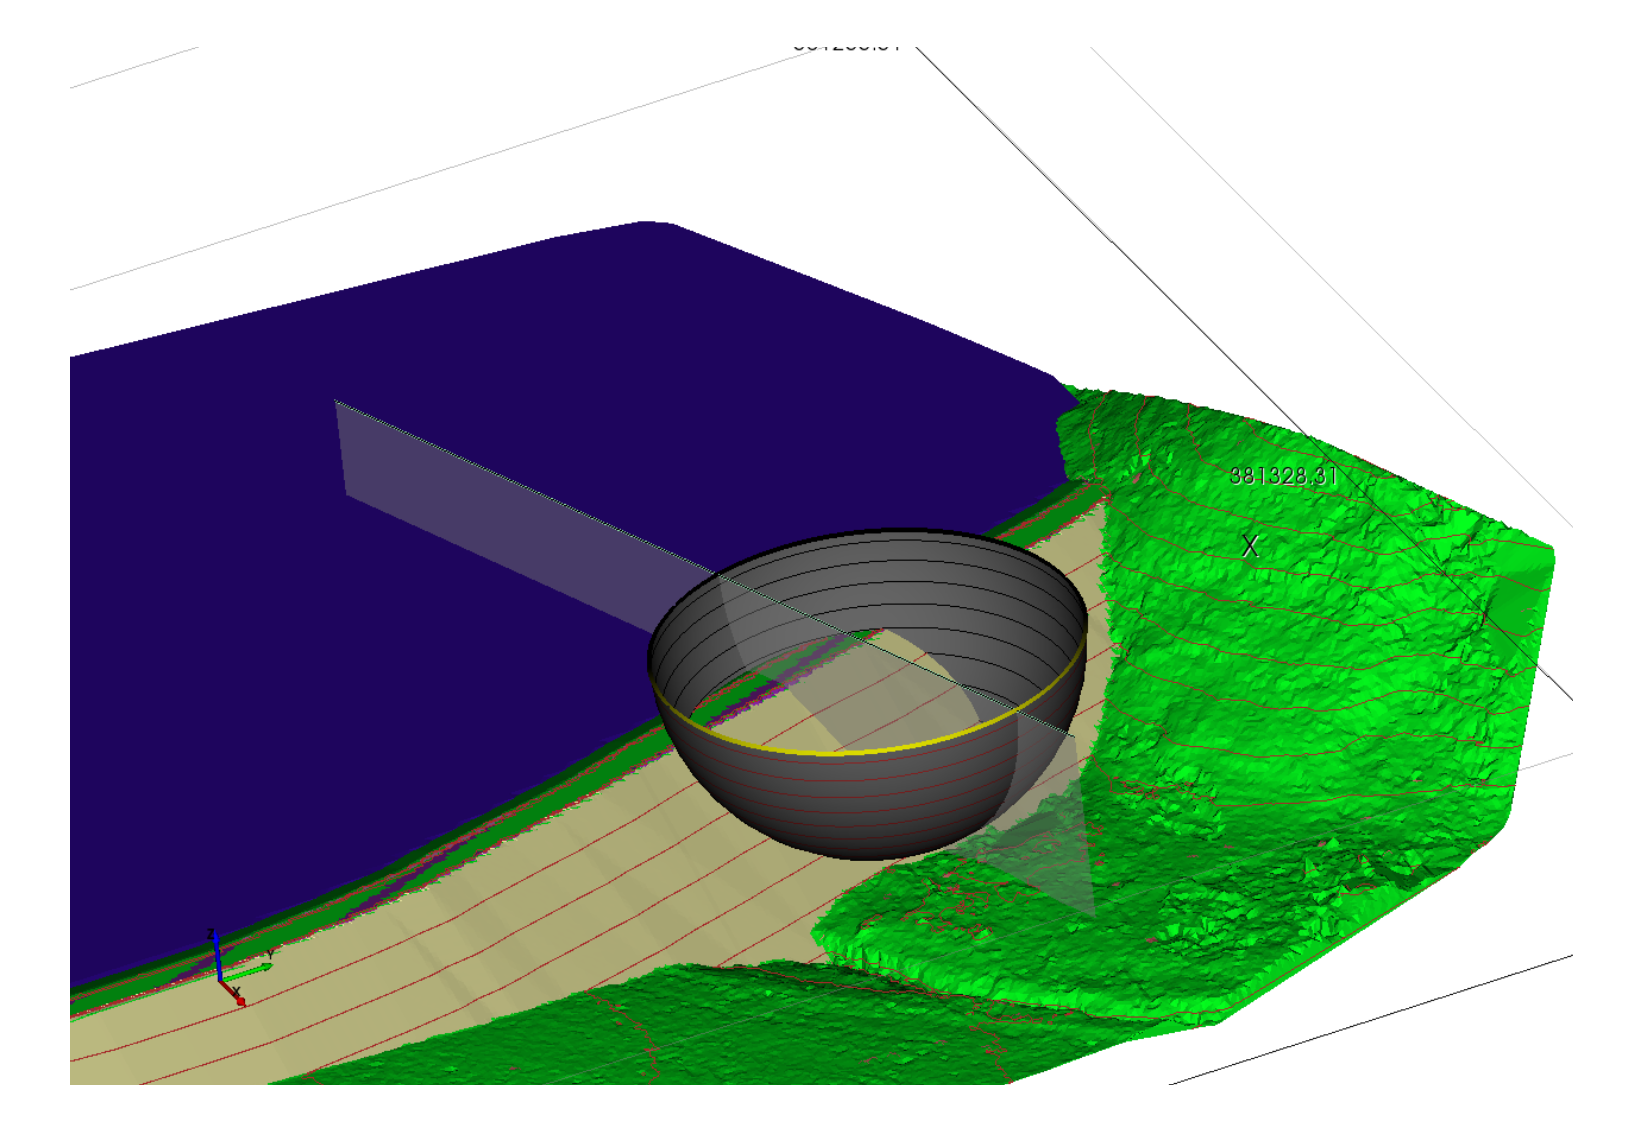
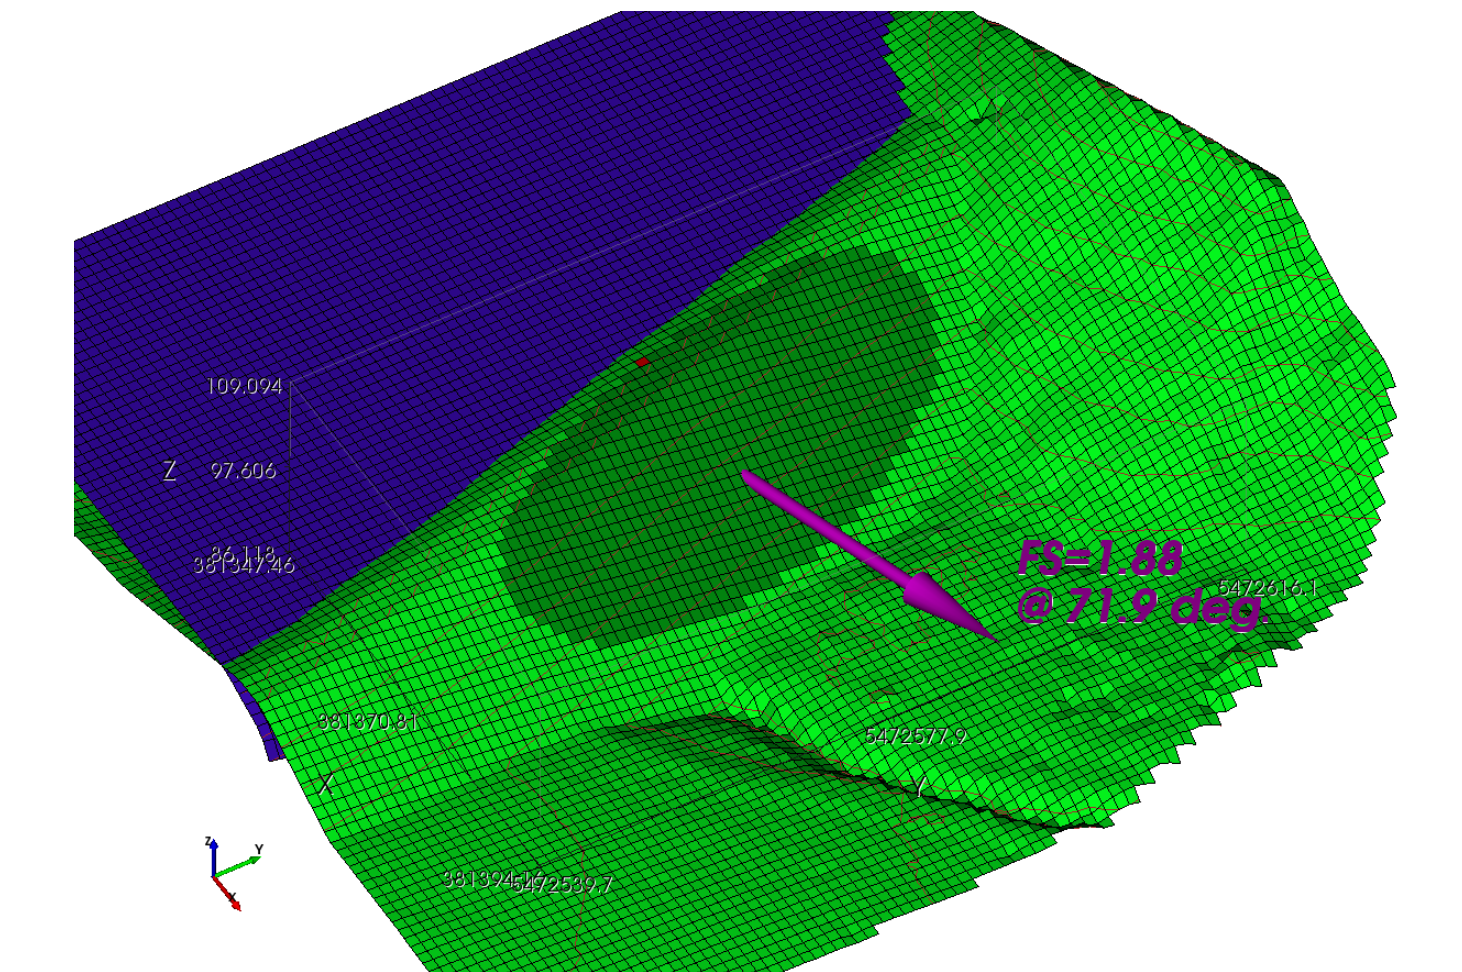
3D ellipsoid with 2:1 axis ratio.
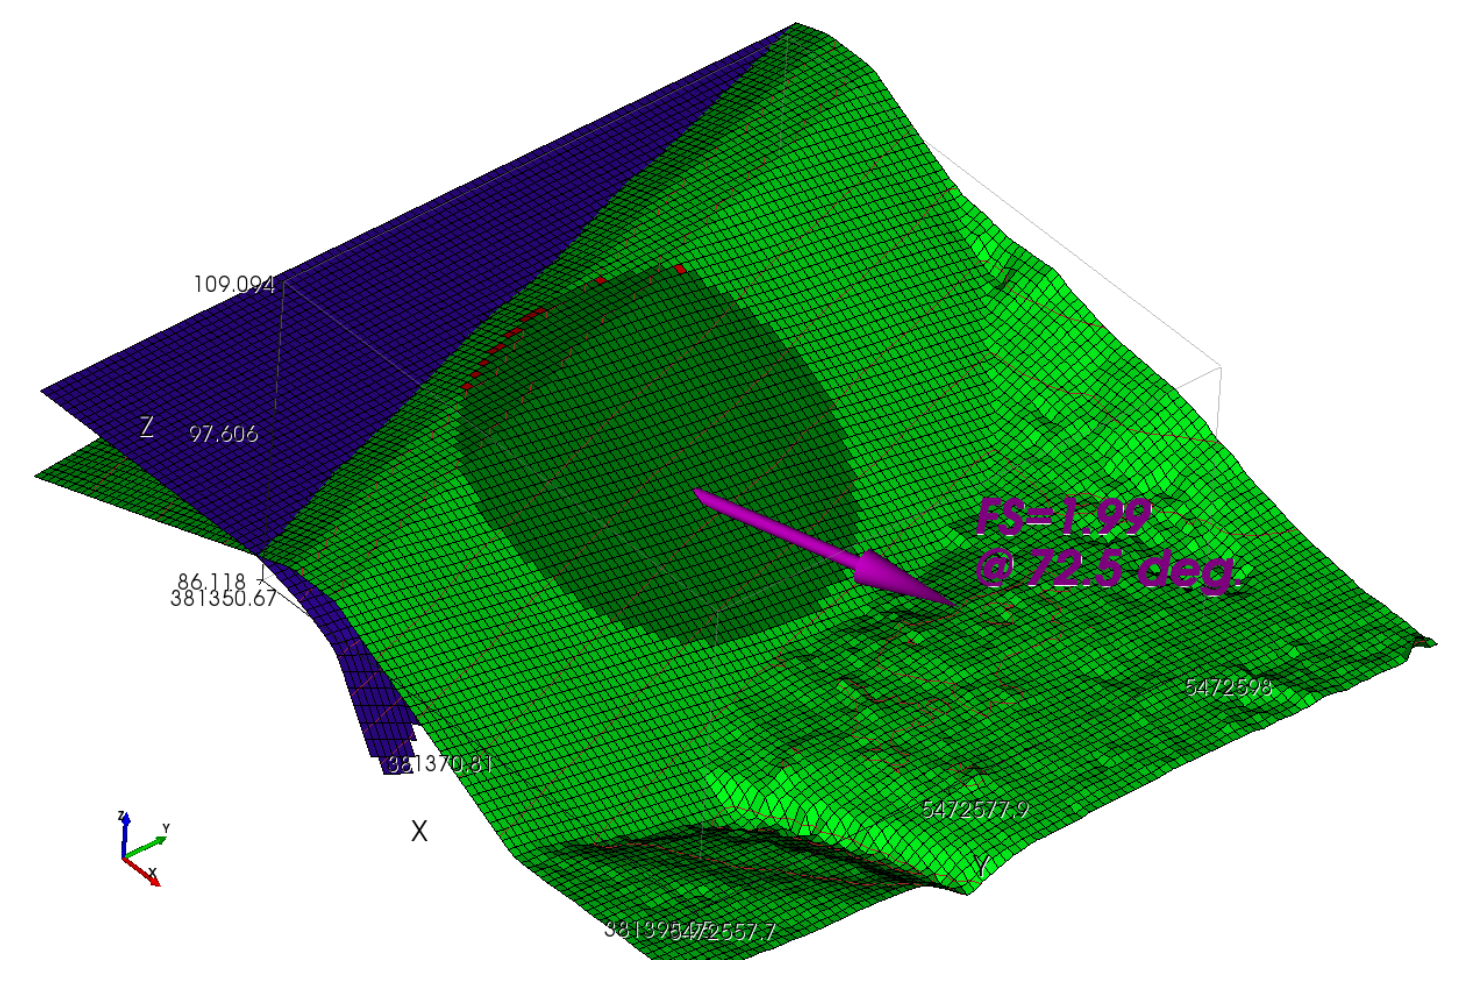
3D spherical surface equivalent to the 2D critical circle.
3D ellipsoid with 0.5:1 axis ratio.
Project Background
The proposed dam comprised a low permeability core, with higher permeability upstream and downstream shells. The dam was to be constructed using local soils borrowed from the reservoir area.
The 3D model was developed using Leapfrog and exported for use in TSLOPE. A phreatic surface was included in the TSLOPE model for the stability analyses.
Material properties
- Core: c = 20 kPa, Ø = 25°
- Upstream shell: c = 10 kPa, Ø = 25°
- Downstream shell: c = 10 kPa, Ø = 25°
- Foundation soils included as a separate model layer
- Phreatic surface included for groundwater conditions
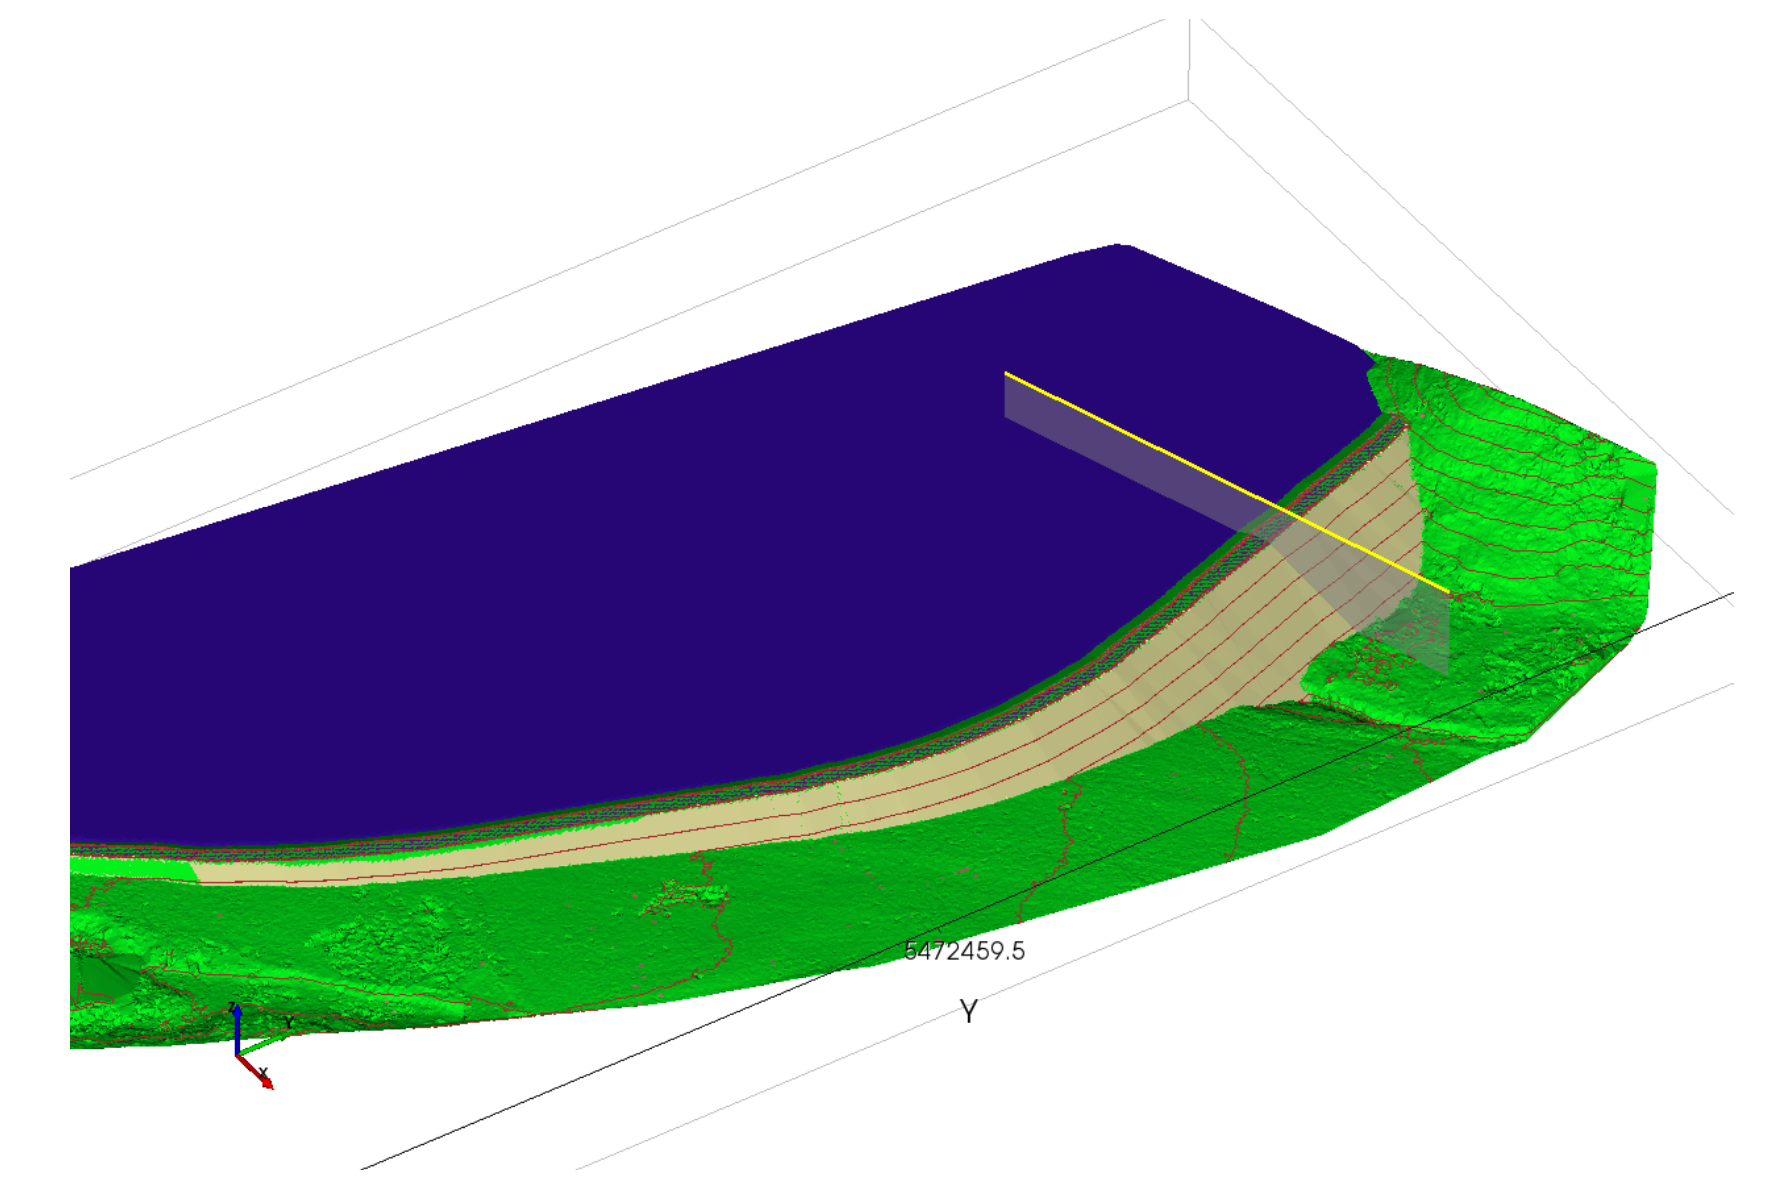
TSLOPE Model Setup
The surfaces modelled in Leapfrog were exported as OBJ files and loaded into TSLOPE. The composite top surface included the upstream ground, upstream dam face, dam crest, downstream dam face, and downstream ground.
Four layers were loaded into TSLOPE and assigned material properties: upstream shell, core, downstream shell, and foundation soils.
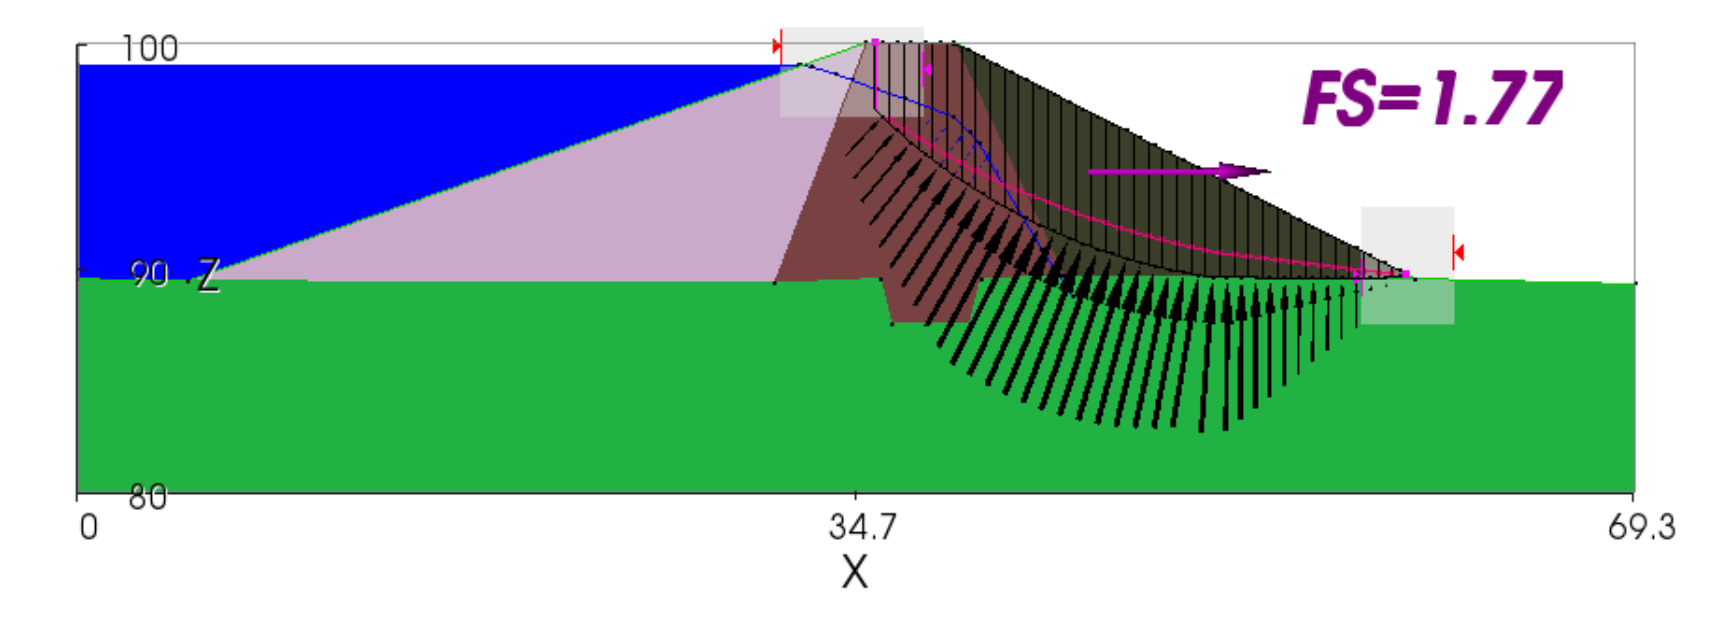
2D Slope Stability Analysis
A 2D cross section through the dam was analysed using Spencer’s Method and the Ordinary Method. For the Spencer analysis, a tension crack was introduced so the line of thrust remained within the potential sliding mass.
The 2D Spencer analysis gave a factor of safety of 1.77. The Ordinary Method result for the same section was 1.65.
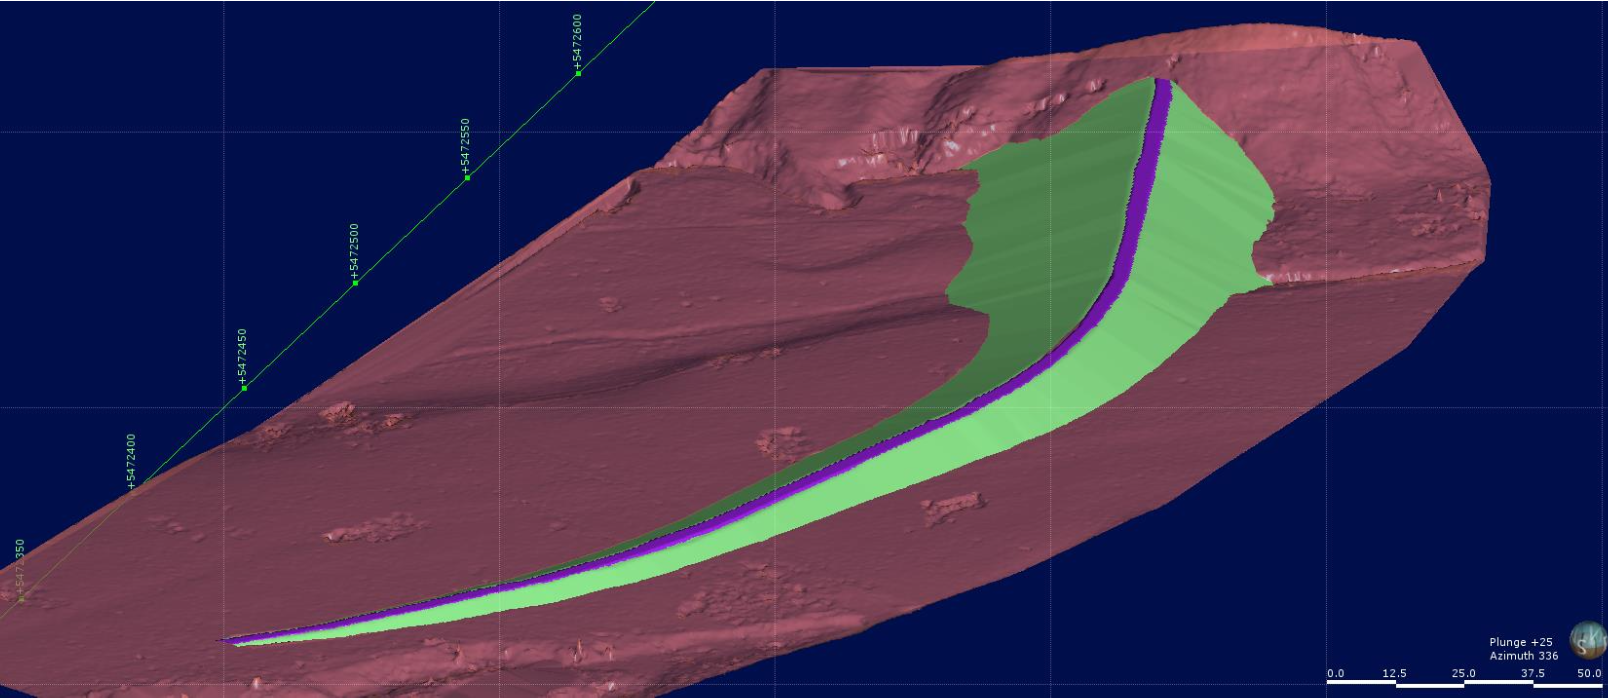
3D Slope Stability Analysis
The critical 2D circle was used as the basis for comparable 3D analyses. The 3D failure surface was then assessed as a sphere and as ellipsoids with different axis ratios.
This allowed the calculated factor of safety to be compared across equivalent 2D and 3D failure surface geometries.
| Analysis | Failure shape | Factor of Safety |
|---|---|---|
| 2D | Circle | 1.77 |
| 3D | 2:1 ellipsoid | 1.88 |
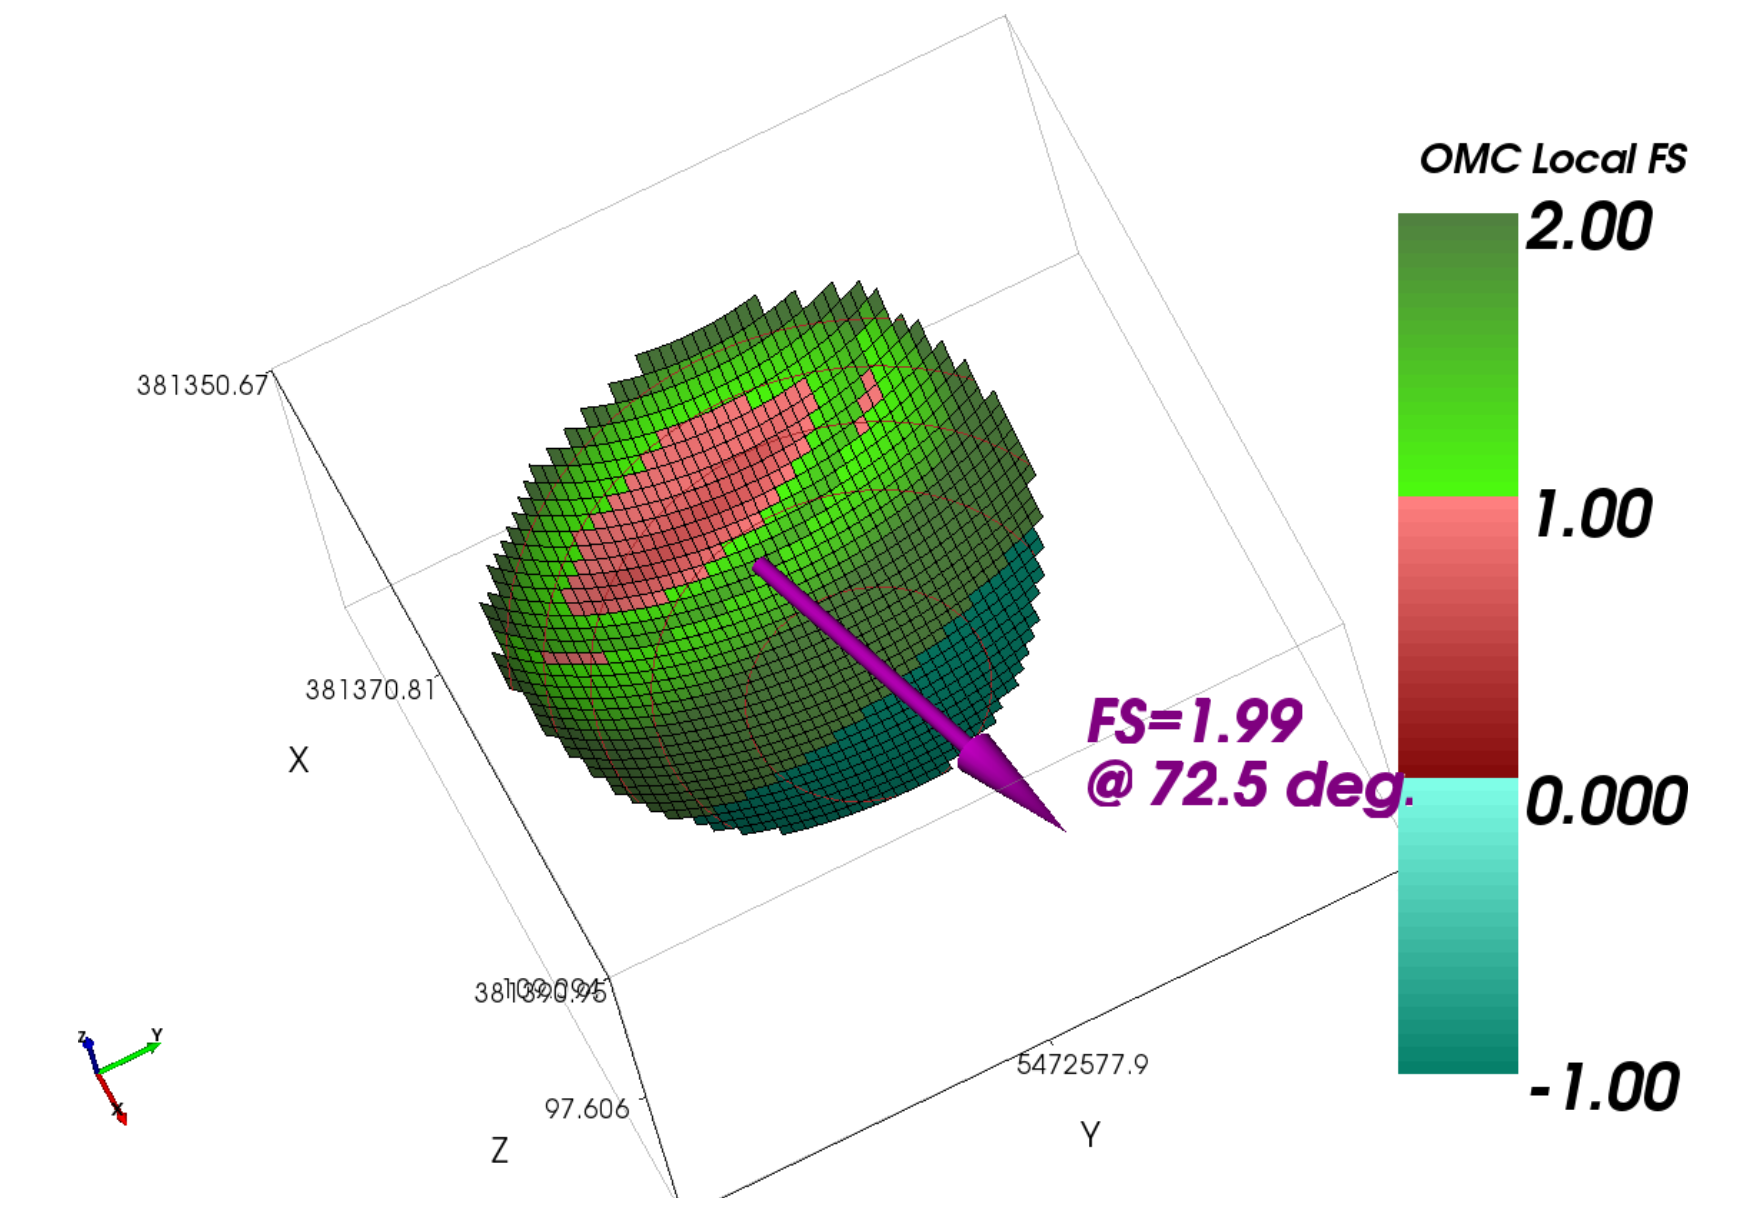
| 3D | Spherical | 1.99 |
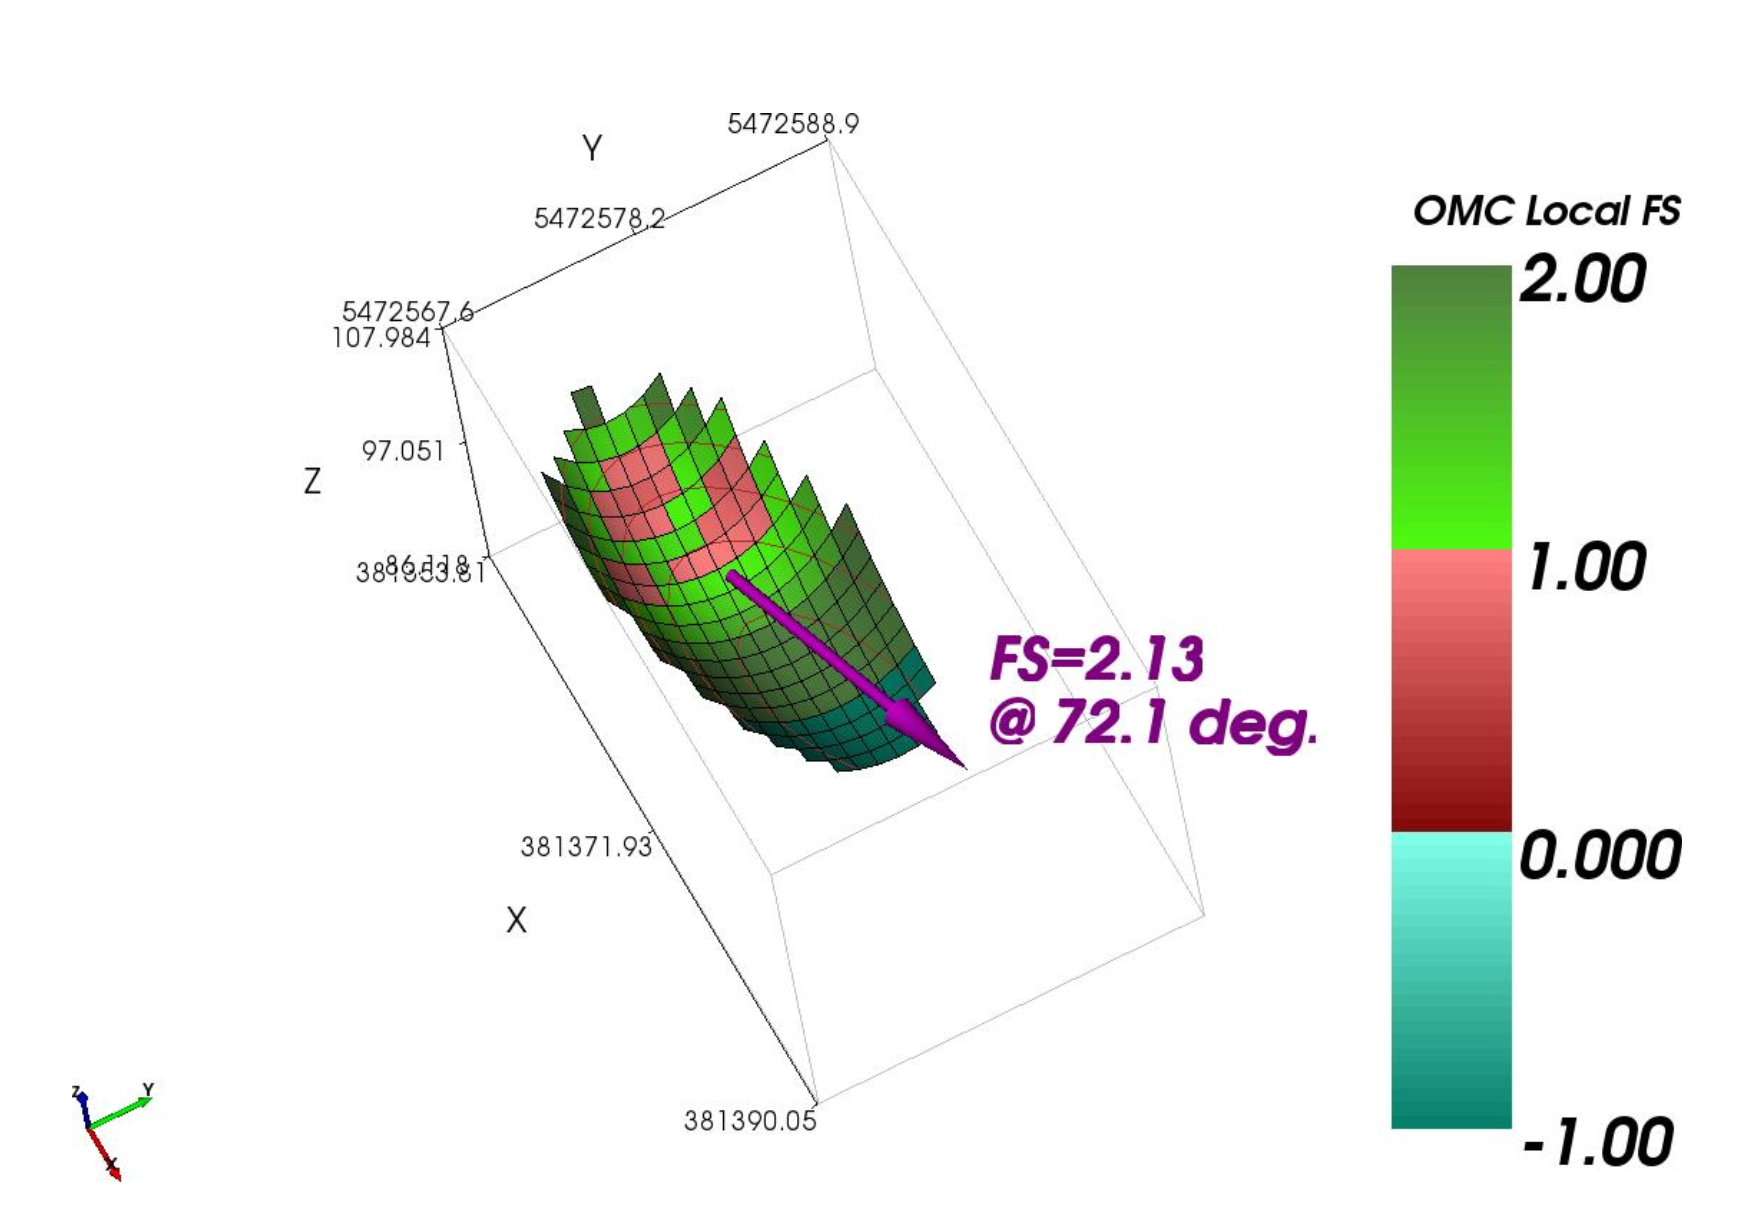
| 3D | 0.5:1 ellipsoid | 2.13 |
Failure Surface Shape Comparison
The 3D analyses showed a change in calculated factor of safety as the failure surface geometry changed from a sphere to ellipsoids with different axis ratios.
The 0.5:1 ellipsoid gave the highest calculated factor of safety for this dam model.
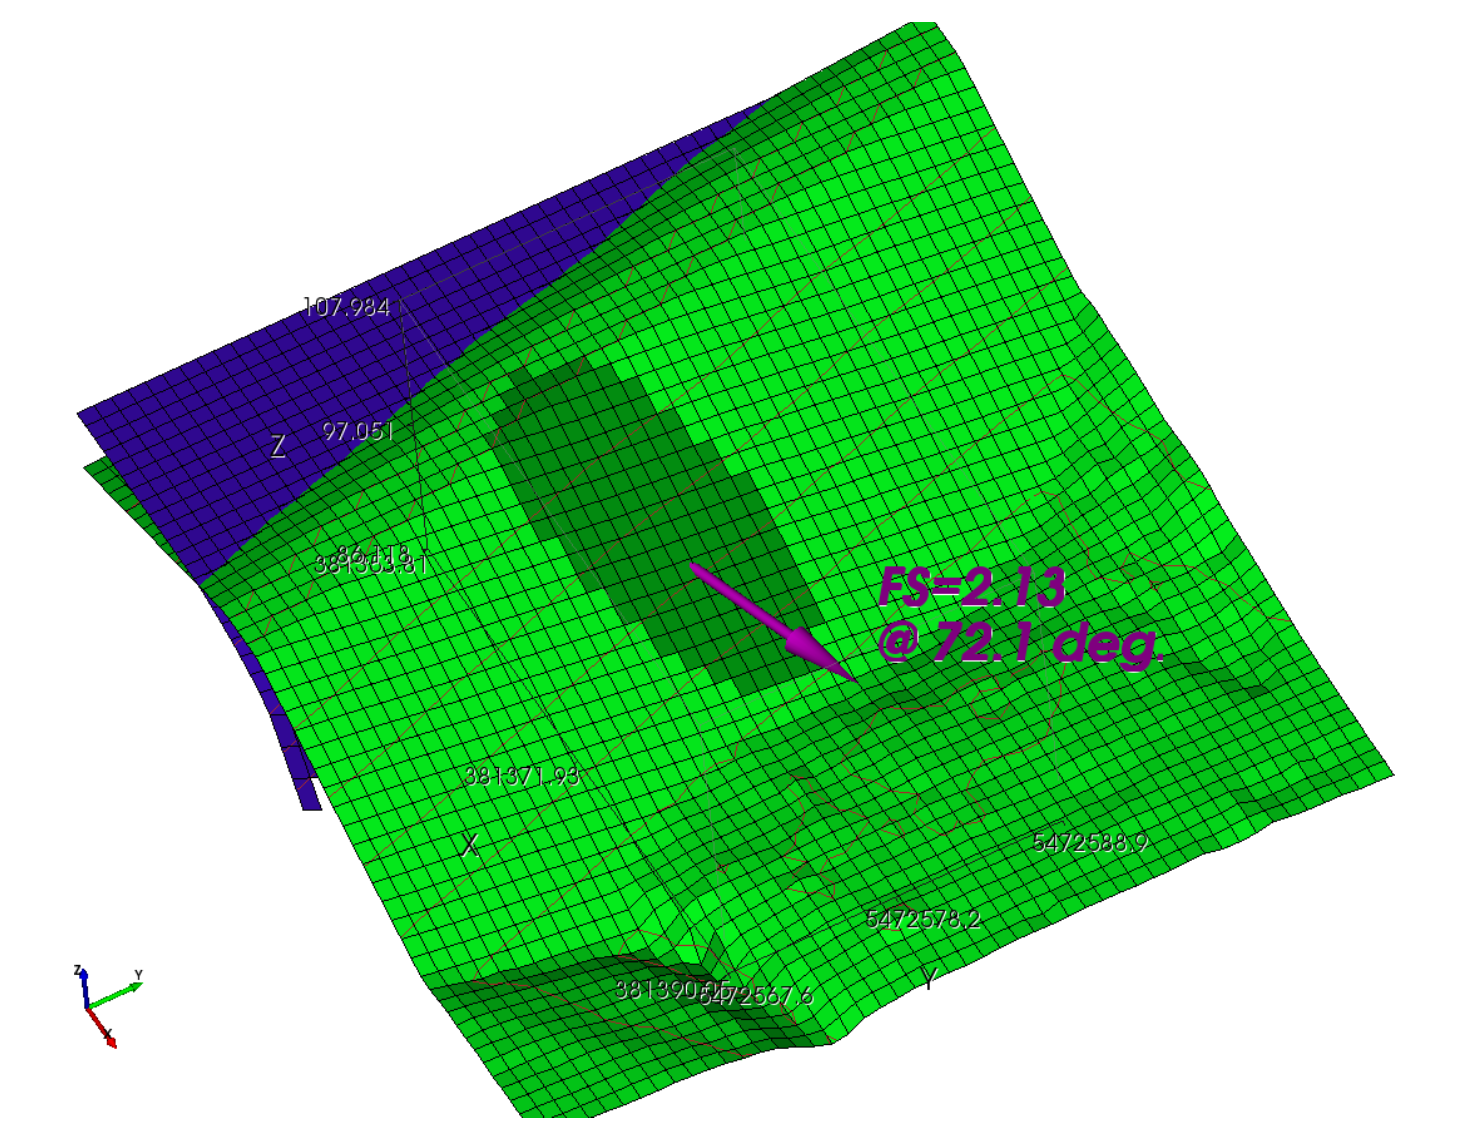
Local Factors of Safety
Using the Ordinary Method of Columns, local factors of safety were plotted at the base of each column.
Columns with factors of safety less than one contributed driving forces, while columns with factors of safety greater than one provided resisting forces.
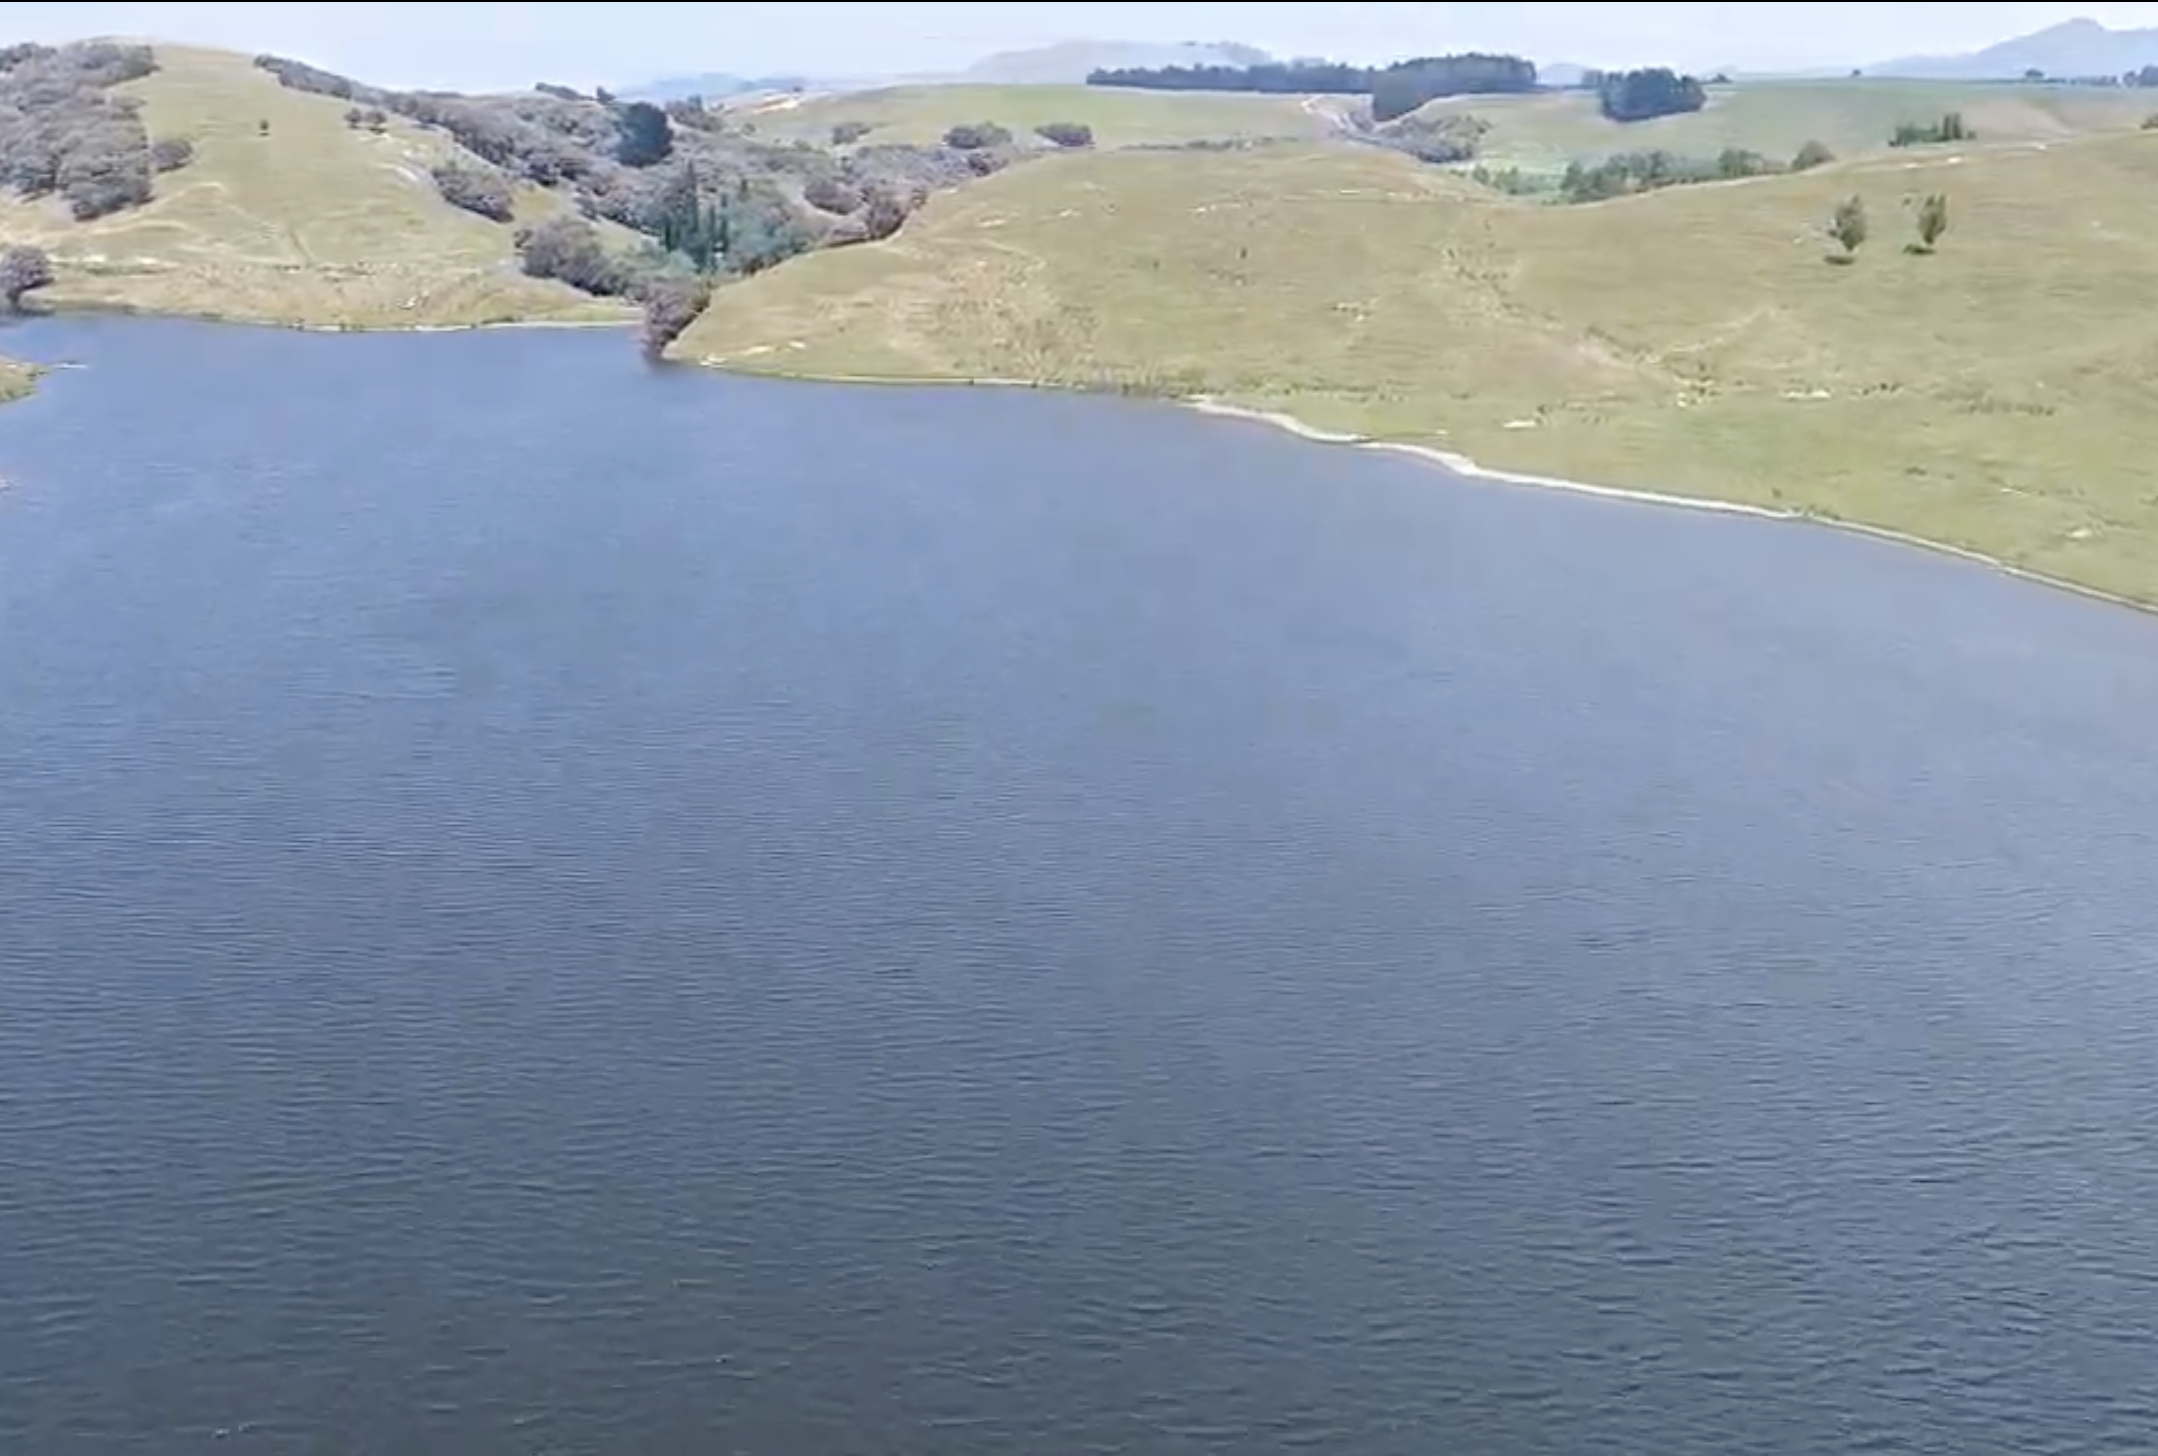
Finished Dam Drone Flyover
The drone flyover shows the completed zoned earth fill dam after construction.
Engineering Takeaway
For this zoned earth fill dam, the 2D analysis was conservative when compared with the equivalent 3D analyses. The difference was controlled by the dam geometry and the relative area of the failure surface passing through the weaker core material compared with the stronger shell material.
The conclusion is not that 3D analysis will always increase the calculated factor of safety. The calculated relationship between 2D and 3D results depends on the slope geometry, material zoning, groundwater conditions, and selected failure surface.
2D and 3D Slope Stability Analysis in TSLOPE
TSLOPE supports 2D and 3D limit equilibrium analysis for dams, embankments, slopes, and other geotechnical models.
- Import 3D geometry directly into TSLOPE
- Assign material zones across layers and foundation soils
- Represent groundwater using phreatic surfaces
- Compare 2D and 3D slope stability results
- Plot local factors of safety across a 3D failure surface